

1111IESPDJ/iStock Unreleased via Getty Images
Dividend investing remains one of the most fundamentally successful investing models. The value proposition follows the idea of “a bird in the hand is worth two in the bush”, meaning pay me now rather than promise expansion.
Dividend-paying companies are generally mature businesses with a more limited set of growth prospects. Dividend critics will often bring up opportunity cost, citing that dividends are capital that the company could have invested to grow. This operates under the assumption that the capital would be productively reinvested. This is simply not the case with various examples including Altria Group, Inc.’s (MO) investment in JUUL and Apple Inc.’s (AAPL) self-driving money pit.
As a business matures, identifying growth opportunities becomes more difficult.
The lack of opportunity encourages large, well-established businesses to seek alternative uses for cash such as dividend payments or share repurchases. While share repurchases have increased in popularity since they were unleashed in the 1980s, most shareholders still look at a stock’s dividend as an important piece of total return. Additionally, dividends offer stability and other attractive incentives for specific investors.
Today, we will compare the three largest dividend-focused exchange-traded funds. We will differentiate their strategies and explain why one fund stands above the rest for dividend investors.
- Vanguard Dividend Appreciation Index Fund ETF Shares (VIG).
- Vanguard High Dividend Yield Index Fund ETF Shares (VYM).
- Schwab U.S. Dividend Equity ETF (SCHD).
First, let’s explore dividends in greater detail and explain why they work for long-term investments.
Dividends & Total Return
Despite the increasing popularity of share repurchases and the broad deleveraging of corporations, dividends have still accounted for nearly half of the market’s total return. Below is an illustration of the Vanguard Total Stock Market Index Fund ETF Shares (VTI) with and without dividends reinvested over a period of 20 years.
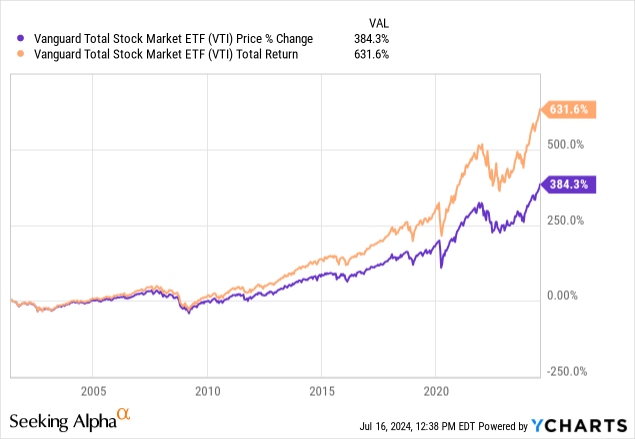
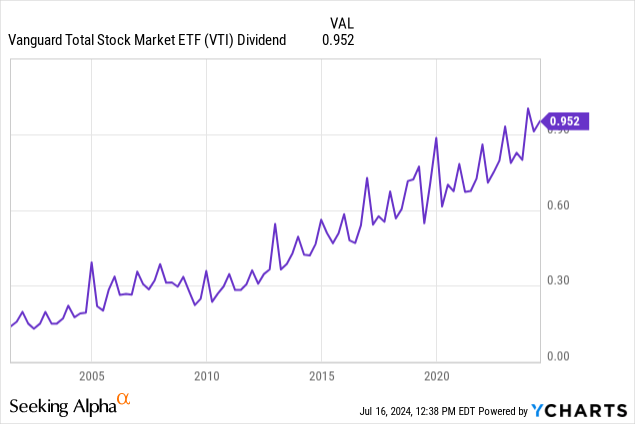
As the illustration above shows, a material portion of the total return of equity investments has been delivered in the form of dividend payments. Over time, dividends have grown alongside the price of the market, increasing faster than inflation.
The Effects of Dividends
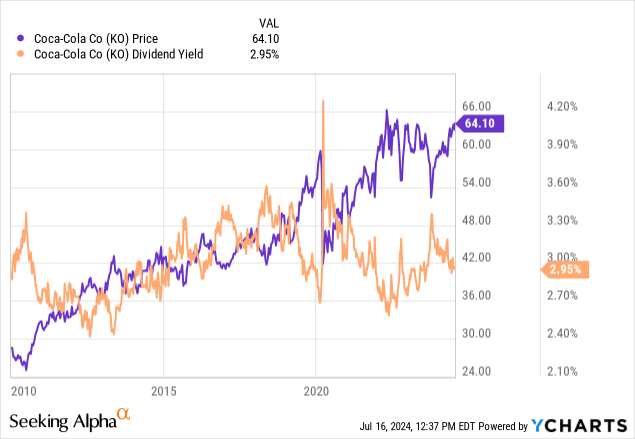
The recurring return provided by dividends to shareholders creates a buoying effect on the valuation of an underlying stock. The recurring cash payment from stable operations of a blue chip business provides a degree of gravity for the stock price. As an example, The Coca-Cola Company (KO) has traded within a relatively tight range of long-term dividend yield. Over most timespans, KO shares yield around 3%. As the dividend increases, so does the share price meaning the two metrics are heavily correlated.
This effect is similar at the fund level. Dividend and dividend growth funds have built a yield range over long time horizons. The long-term yield range acts as a buoy for the fund’s valuation. Yield moving too low could prevent shares from advancing and investors could start putting money in if the yield reaches historically high levels.
Looking at VIG, the largest dividend ETF by assets, as a specific example, the result is clear over the past 10 years. The fund’s dividend yield based on trailing twelve-month payments has remained within a range of 1.50% to 2.50% since 2010, without any exceptions.
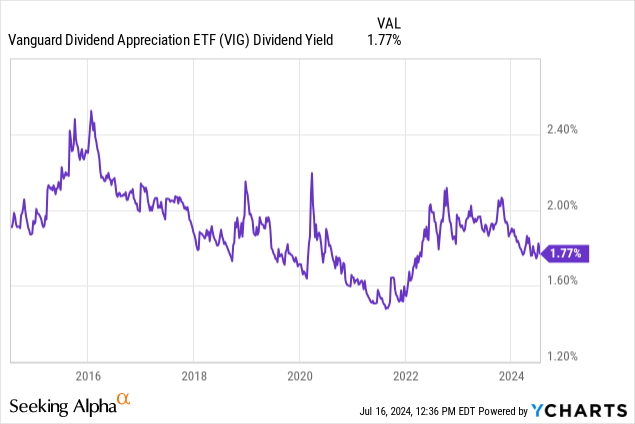
Over time, you’ll notice the relationship between the price of the ETF’s shares and the dividends paid. Given the yield has remained locked into a defined range, the fund’s price appreciates alongside the dividend payments.
VIG emphasizes dividend growth and over the past ten years, the dividend has grown by over 8% annually. Given yield has remained steady, this means shares of the fund have appreciated at a similar pace. On a combined basis, this amounts to a total return of approximately 10% annually.
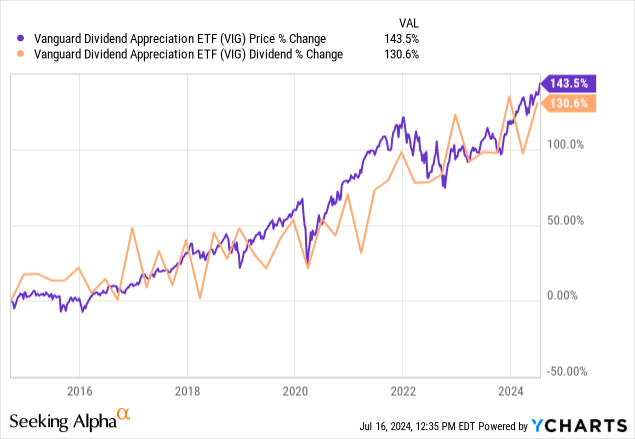
This is a critical concept for dividend and dividend funds. Price appreciation is inexorably connected to the movement of the investment’s dividend, assuming the relative risk does not change. So, this boils down dividends to a relatively simple idea. If all else remains equal, increasing dividends means increasing the share price.
Why Do Dividends Grow Over Time?
Dividend growth requires increasing cash flow through a business, assuming it is not borrowing to facilitate payments or sourcing capital more creatively. Healthy companies monitor their dividend payout ratio and generally aim to maintain some degree of consistency and margin of safety. Management wants the dividend to grow alongside operations. Ideally, the dividend will not begin absorbing cash currently budgeted for other line items.
This means earnings growth is the primary driver of increasing dividend distributions.
Earnings growth comes from a variety of sources. Generally speaking, growth of operations, acquisition of competition, funding of new ventures, etc. will contribute to the long-term increase of earnings for a company.
RBC Wealth Management recently put out a report centered around forward earnings for large capitalization companies. Despite a forecasted deceleration for the Magnificent 7 stocks, broad earnings growth is expected to continue to remain strong over the next twelve months.
Regardless of the Q1 earnings results and the market’s reaction, we think the full-year 2024 earnings trajectory is more important to long-term investors. And here a notable, positive shift is taking place….
The two growth rates should nearly converge to around 14 percent by Q4 2024, according to Bloomberg consensus estimates, which would be well above average.
RBC Wealth Management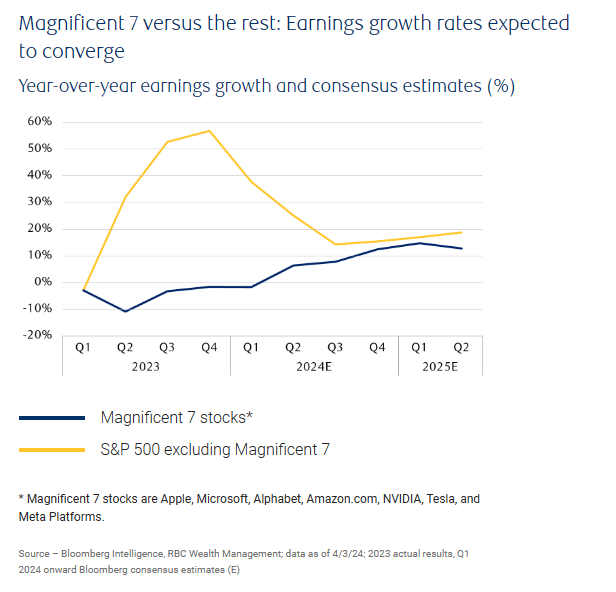
As earnings continue to increase over the next twelve months and longer time horizons, it means companies will similarly increase their dividend distributions to shareholders. However, putting aside company-specific mechanisms for growth, the organic growth of the economy serves as a fundamental driver for dividends. As inflation increases the cost of goods, services, and materials, companies who maintain their margins will see funds for dividends increasing. If other variables stay the same, the long-term inflation assumption of 3% should correspond to a similar increase in dividends.
Looking past traditional sources for growth, more complex financial engineering mechanisms also contribute to growing dividends.
Share Buybacks
Since the 1980s, buybacks have grown as an increasingly important component of corporate finance and strategy. A brief history of buybacks shows the complex and controversial concept behind share repurchase agreements. According to Forbes:
For most of the 20th century, stock buybacks were deemed illegal because they were thought to be a form of stock market manipulation. But since 1982, when they were essentially legalized by the SEC, buybacks have become perhaps the most popular financial engineering tool in the C-Suite tool shed. And it’s obvious why Wall Street loves them: Buying back company stock can inflate a company’s share price and boost its earnings per share metrics
Let us cue in on the last sentence as it relates specifically to dividends and corporate growth. As the article states “buying back company stock can inflate a company’s share price and boost its earnings per share metrics.”
The math behind buying back shares is simple. Reducing the denominator of per share metrics without moving the numerator increases the per share metric. This means repurchased shares act as a rising tide for earnings per share irrespective of top line earnings growth. However, the benefits are even deeper.
Removing shares from circulation also removes the perpetual dividend burden of those shares. This means the company is no longer responsible for distributing cash on those shares on a forward basis, a benefit that comes in addition to EPS growth. While the pool of capital allocated to the dividend remains the same, the number of shares has decreased meaning the available funds per share has increased. Without increasing top line revenue, a hypothetical company could still increase the dividend without impacting the payout ratio.
According to an article from Bloomberg, share repurchase activity slowed in 2023. As companies faced increasing interest expenses and rising costs, there was less cash available to allocate to share buybacks. This also stemmed from increased research and development spending across healthcare and biotech.
US share buybacks are set to surpass $1 trillion next year for the first time ever, thanks to strong mega-cap technology earnings, strategists at Goldman Sachs Group Inc. said. For 2024, the bank expects S&P 500 stock repurchases to grow by 13% to $925 billion and a further 16% in 2025 to just over $1 trillion, rebounding from last year’s decline…
Buybacks are viewed more flexibly than dividend payments. While most companies feel the need to treat the dividend with consistency, growing it over time, buybacks can be allocated on a year-to-year basis with less scrutiny from shareholders.
According to The Goldman Sachs Group, Inc. (GS), buyback activity is now running at a 50% year-over-year increase. This enormous increase in buyback activity will act as a meaningful driver to improve EPS metrics for large companies. This growth will trickle down to the dividend payments which should similarly grow over the coming years.
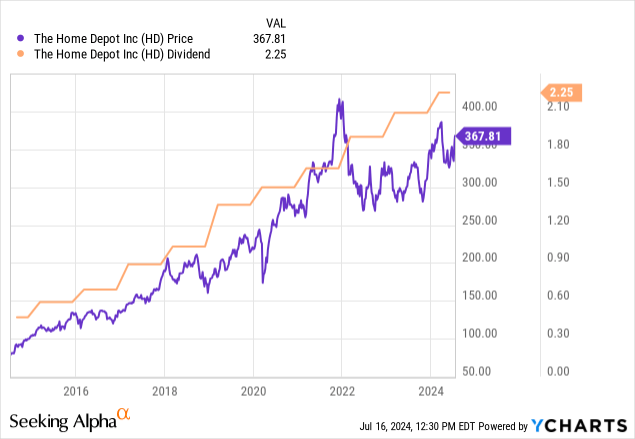
On the list of repurchasers are some of the largest companies that also pay rising dividends, including The Home Depot, Inc. (HD) with a $15 billion repurchase program that was reauthorized less than twelve months ago. Coincidentally, HD is also one of the most prolific dividend payers of the past decade. Over the past ten years, HD has increased their dividend by 17.6%, annually.
The stage is set for years of dividend success. The question becomes how to invest in dividends. Let’s explore three of the largest dividend-focused exchange-traded funds.
Dividend Fund Comparison
Below is a matrix of data from the three largest dividend exchange-traded funds. The funds are managed by The Charles Schwab Corporation (SCHW) and Vanguard, two of the largest asset managers. Each fund follows a specific index with a strategy broadly based around dividends.
REITer’s Digest, Vanguard, Charles Schwab
At REITer’s Digest, we cover each of these funds individually with an in-depth analysis of the underlying index and portfolio. Below is a link to our most recent coverage of each fund for more specifics. Each fund has a unique focus and specific dividend investing style.
However, to compare these three funds for dividend investors, the matrix above compares current yield, long-term growth, and total returns to create a composite score. Each category was ranked high to low based on relative performance. The score of each category was combined to create the composite score which was equally weighted between the three contributing metrics.
Expenses were excluded as a category since each fund charges the same expense ratio of 6 basis points.
The Winner Is…SCHD
In our previous coverage of SCHD, we provided a comprehensive overview of the fund explaining the index, methodology, and distribution history. Since we published the article, the fund’s strategy has remained the same, following the same index. In an effort to avoid redundancy, we will direct you back to our previous coverage for information on SCHD’s underlying methodology.
However, there have been several changes to the fund and outlook since March. For example, a rebalancing took place which removed successful performers including AVGO, and replaced them with higher yielding opportunities as decided by the index’s underlying math.
Today, SCHD is still the only domestic ETF which tracks the Dow Jones Dividend 100 index.
Dow Jones U.S. Dividend 100 Index. Measures the stock performance of 100 high dividend-paying U.S. companies with a record of consistently paying dividends, selected for fundamental strength relative to their peers, based on financial ratios.
SCHD’s portfolio is constructed from 100 dividend-paying, U.S.-based companies with histories of rising dividends. Coincidentally from the case study above, SCHD’s largest holding is currently HD accounting for 4.2% of the portfolio. The index selects financial metrics to determine the health and the viability of future increases to allocate assets. The acceleration of share buybacks could serve as an extraordinary catalyst for SCHD over the next twelve months as companies consolidate their financials following hefty repurchases.
We crowned SCHD the top dividend fund with a current yield of over 3.5% and a ten-year dividend growth rate of 11%. The fund’s dividend growth rate has been accelerating consistently with an 11% five-year CAGR and 11% growth rate since inception. Over time, SCHD’s index methodology has proven worthy of a long-term investment with consistent annual dividend growth since the fund’s inception. In opposition to other dividend-focused funds, such as WisdomTree U.S. Quality Dividend Growth Fund ETF (DGRW), SCHD’s distribution has grown each year since the fund’s inception.
Given SCHD and similar exchange-traded funds are “buy and hold” investments for most shareholders, the fund’s yield on cost is relevant. For SCHD investors who have owned shares for a decade, our original investment now yields nearly 8%.
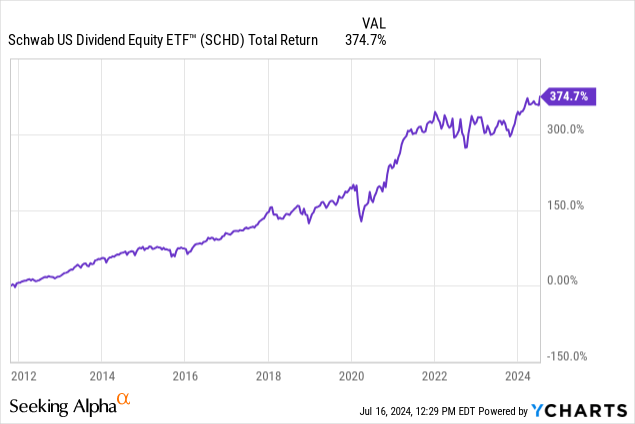
In fact, SCHD is one of few true value-focused index ETFs to have competed alongside the S&P 500 for the decade leading up to the pandemic.
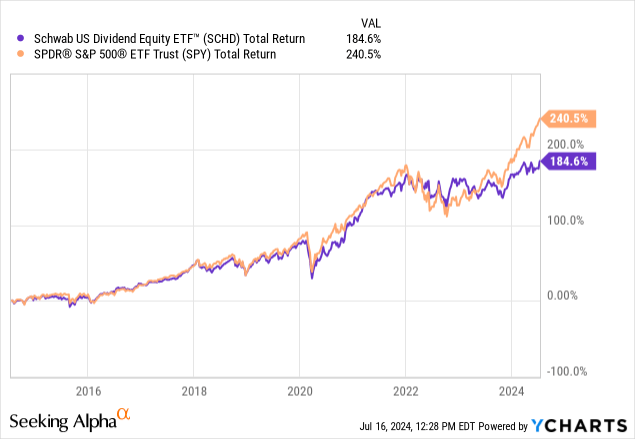
The fund has performed exceptionally well over long time periods. Without investment in the Magnificent 7, SCHD performed in line with the S&P 500 until 2023, when dividend-paying equities began to underperform mega-cap tech companies.
The past two years have seen an extraordinary increase in concentration risk for indices as a handful of names account for an increasing portion of the overall return of the equity markets since 2015.
Goldman Sachs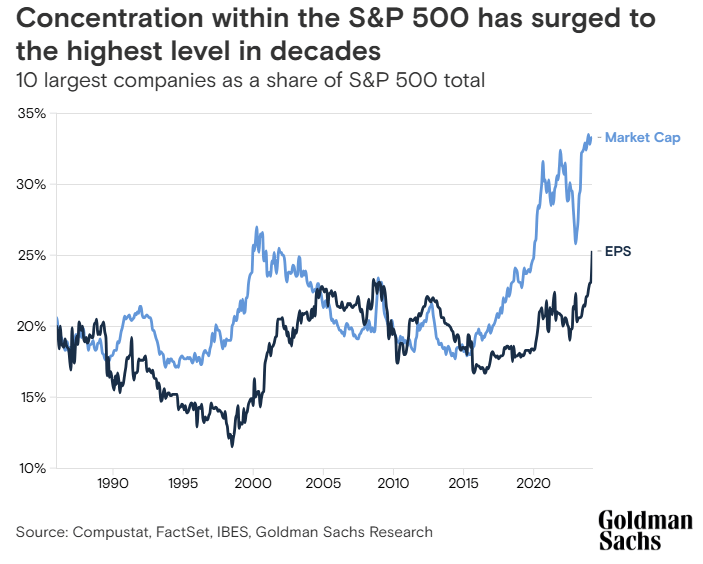
The increasing concentration risk in the S&P 500 is the reason behind our upgrade of SCHD to a “Strong Buy”. While dividend funds have historically underperformed the S&P 500 and NASDAQ 100, the increasing concentration over the past twelve months presents a compelling opportunity to add to baskets with differentiated assets. The ten largest constituents of the S&P 500 now account for one-third of the entire index.
SCHD offers something different without any investment in the Magnificent 7 in the fund’s top ten holdings. In fact, the top holdings are currently closely aligned with what a value investor would expect. Currently, the largest positions are The Home Depot, Inc. (HD), Amgen Inc. (AMGN), and BlackRock, Inc. (BLK) accounting for nearly 13% on a combined basis.
Over time, earnings fatigue and mean reversion may constitute an advance of value stocks. SCHD’s value-oriented portfolio excludes the expanded technology players, focusing instead on traditional dividend payers.
Conclusions & Takeaway
SCHD is the gold standard of dividend exchange-traded funds. SCHD offers an opportunity to invest outside of the most concentrated sectors of large equity indices at a low cost. In fact, SCHD could be an opportunity to diversify your core holdings of equity funds as major indices become more and more concentrated. As the Magnificent 7 accounts for an increasing portion of the stock market, investors may be seeking high-performing funds which lack investments in these large names.
While many indices have snuck in lower yielding names such as NVIDIA Corporation (NVDA) and Microsoft Corporation (MSFT) to juice performance, their yields have suffered. Meanwhile, the Dow Jones Dividend 100 is a true value index which sheds exposure to these large, overconcentrated technology names, staying closer to the mission of a value fund.
As we evaluate the three largest dividend funds, only one can be crowned the king. SCHD remains one of the best options for dividend investing on account of the fund’s low expense ratio, high yield, and category-leading long-term dividend growth rate.


