

Robert Way
Thesis
Lululemon Athletica Inc., (NASDAQ:LULU) commonly known as Lululemon, is a Canadian-American multinational athletic apparel retailer headquartered in British Columbia and incorporated in Delaware, United States. The stock has performed exceptionally well, gaining more than 50% in value in 2023. While it trades at a rich valuation of close to 60 times earnings, I believe the stock is still undervalued with positive catalysts such as its pricing power, growth in market share, and the rapid pace of growth in international markets as its tailwinds.
Catalysts
Consistency and Possible Expansion in Gross Margins
One of Lululemon’s strengths is its pricing power. This is very well reflected in its gross profit margins remaining constant at around 56-58% since 2018. This shows that the company did not need to significantly discount its goods to sell them. I see this as a sign of strong brand value and consumer loyalty. The company has always focused on high-quality products and its customer insights. Over the years, it has achieved to build a cult-like following. The company also invests heavily in research and development, as well as in marketing, to build a strong brand image.
Lululemon has fostered strong brand loyalty through unique marketing and community-focused strategies. Customers are engaged through platforms like the “Lululemon Addict” blog and experiences like free yoga classes and running clubs. These initiatives create a sense of community and connection to the brand. Additionally, the company enhances customer loyalty by offering free shipping for online orders and personalized experiences like free alterations in stores, further personalizing the shopping experience and fostering a loyal customer base.
All of the above contribute to a higher price point for its products. Lululemon’s business model has allowed the company to carve a niche for itself in a crowded market. Even when raw material prices increased during the post-COVID inflationary period, the company’s gross profit margins remained unaffected. Unlike Nike and other competitors, Lululemon’s products are almost exclusively sold in its store or website. Lululemon does not rely on retailers for sales, therefore, allowing it to price its products on favorable terms and increase margins
Going forward, I expect that Lululemon’s Gross Margins will continue to grow with the worst of input inflation behind and freight costs dropping sharply since early 2022. As per PYMNTS, container shipping rates have dropped nearly 90% since late 2021/ early 2022. While ship operators face challenges, the decline in shipping rates benefits shipping clients, particularly large retailers, per the report. The below image from Drewry Supply Chain Advisors shows the Year-over-Year change in Shipping Container Rates for different locations.
Drewry Supply Chain Advisors Chartr/SCFI via Wall Street Journal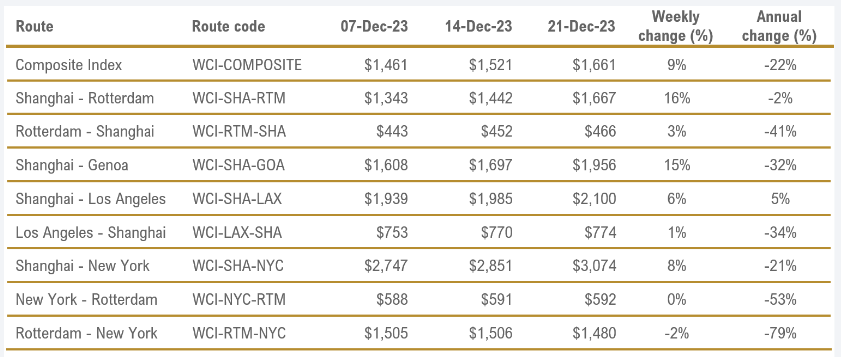

The company is also set to benefit from a decline in textile prices. Global cotton supply is outpacing demand and this has led to a reduction in prices. Even on the Commodities exchanges, Cotton Futures have declined 10% since the end of August 2023. As for Lycra or Spandex which is most commonly used in athletic apparel, prices for Spandex have collapsed in China due to what is being called a market slump. The below graph shows the drop in prices of Spandex material in H1 in 2023, priced in Yuan per metric tonne.
CCF Group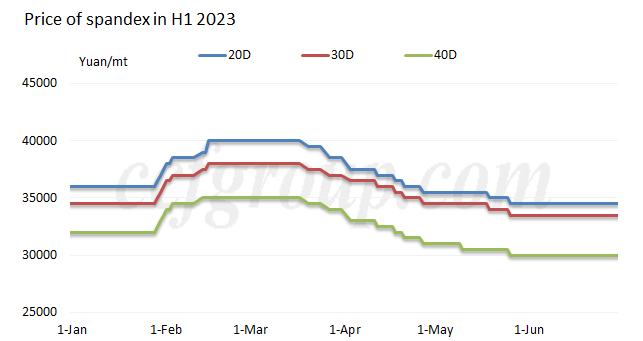
The company has guided gross margins to expand 90 to 120 basis points in Q4 2023 relative to Q4 2022. I expect margin expansion to be higher in the following quarters as Q4 typically involves a lot of markdowns owing to the holiday season discounts.
Gaining Market Share + Large Scope for Growth
Lululemon has been able to grow its revenues faster than its key competitors and the overall industry average which has meant that the company has grown in market share. The global sportswear market is valued at $380 billion today. It is forecast to be worth $455 billion in 2027. This translates to an annualized gain of just 3.7% for the overall industry. Lululemon, on the other hand, has boosted its top line at a compound annual rate of 21.7% between fiscal 2016 and fiscal 2021.
As per the management’s target for FY2026 (ending in January 2026), the company should earn $12.5 billion in revenue. This will take the company’s global market share from around 2% to close to 2.8%. Investing in businesses that are part of expanding industries is one thing. Finding companies that are growing their sales at a faster rate than the industry is even more advantageous. This is the main goal of increasing market share. Stated differently, it’s claiming a larger share of the pie. This is exactly what Lululemon will be doing through its expansion in Global markets, expanding brick and mortar footprint, the rapid growth rate in China, and expansion into fitness accessories.
A large driver of growth in the past has been Lululemon’s ‘Power of Three Growth Strategy’. In April 2019, newly appointed CEO Calvin McDonald (ex-CEO for LVMH’s America division) announced the ‘Power of Three’ Growth Strategy to double the company’s digital revenue, double its men’s revenue, and quadruple its international revenue from fiscal 2018 within the following five years. Lululemon achieved its digital and men’s targets ahead of schedule in fiscal 2021. This April, Lululemon launched a new five-year growth plan called “Power of Three x2.” The goals are the same: it plans to double its digital revenue, double its men’s revenue, and quadruple its international revenue from fiscal 2021 within the following five years. In Q3 2023, Men’s revenue grew 15% YoY, Digital Revenue grew 19% and International Revenue grew 49% YoY.
The exact strategy to grow sales isn’t known. These were targets they had set for the mentioned segments. The strategy could be the prioritization and expansion into these markets in the first place where Lululemon was not very active. The below graph shows the evolution of the revenues of the three target segments as per Lululemon’s Power of Three Strategy in absolute terms and expressed as a percentage of the company’s total revenue.
LULU Quarterly Income Statement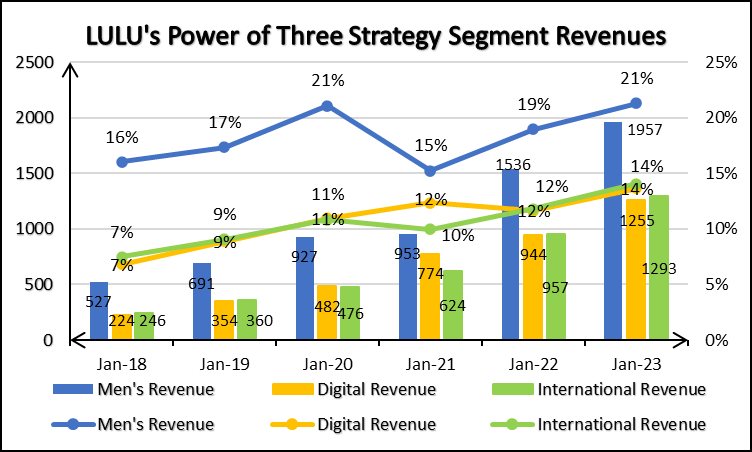
As it did with the first phase of the Power of Three Growth Strategy, I expect the company to achieve its targets ahead of schedule owing to its rapid international growth. We must also not forget that 2 of 3 targets have already been achieved in the second phase of the Power
This will reflect how I value the company.
International Growth Rapid + Fav. Forex tailwinds
McDonald said its international expansion — one of the “key pillars” of its new Power of Three plan — was already off to a “great start.” Its international grew nearly 50% YoY in Q3 2023, faster than expected, led by China and parts of Europe.
Lululemon’s forward-looking statements are highly optimistic. A planned expansion of market penetration, especially in the Asia-Pacific and Europe, Middle East, and Africa regions, where brand awareness is still in the single digits, supports the optimism. Additionally, the business is dedicated to its Power of Three x2 growth strategy, which is anticipated to drive growth in every category. The company continues to invest behind its strategic initiatives to build brand awareness among additional investments it has accelerated to fuel our Power of Three x2 road map. The company is also banking on its ability to increase its brand awareness in global markets, which currently remains in single digits or low double digits.
The dollar has weakened nearly 4% since the end of October and this makes US goods cheaper abroad which means the company benefits from increased sales (in constant terms) as well as the purely forex part of revenues. I expect these tailwinds to continue and likely strengthen as the US Federal Reserve’s dot plot predicts rate cuts whereas other central banks remain hawkish. This will result in a weaker dollar and benefit companies such as Lululemon which earn revenue from outside the US.
Valuation
After looking at the positive catalysts that Lululemon stands to benefit from, let’s look at the valuation of the company.
Revenue Growth: While the market is pricing in 14-15% revenue growth as per analysts’ consensus which is in line with the management’s guidance, I believe that when we take into account the pricing power, the rate of international growth and the increase in market share, revenue can continue to grow at the average rate observed since 2019. It won’t be the first time that actual revenue growth could exceed the management’s targets as well as analysts’ consensus estimates, as we’ve seen once with the first edition of the Power of Three Growth Strategy. I expect revenue growth to be 10% in the next fiscal year owing to growing macroeconomic challenges. However, beyond that, I expect the company to continue growing revenue at ~24%. Gross Margins have been assumed to remain steady between 55%-57%.
My Financial Projections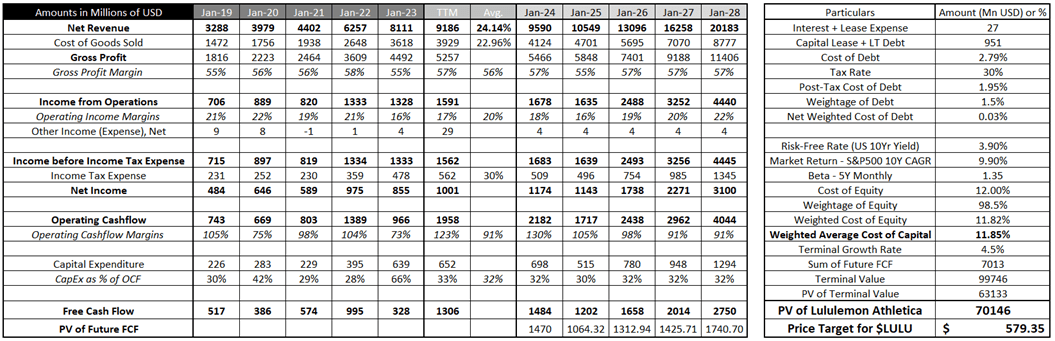
In line with slow growth next year, I’ve assumed margin contraction for the upcoming fiscal year but expansion back to the long-term average. For the Fiscal Year ending January 2028, the margin expansion could come as and when the company’s strategic investments in the production process pay off and the company expands globally and limits payroll expenses by learning through operating (doing) stores abroad. The benefit could also come from advancements in technology that reduce the employee requirements in a store.
Operating Cash Flow Margins mean the conversion ratio of Operating Income to Operating Cash Flow. It is as high this year because of the impairment to goodwill and other assets. It was taken from current levels and assumed to slowly decrease towards the long-term average, to estimate Operating CashFlow. CapEx was estimated using an average % of Operating CashFlow spent on Capital Expenditure over the last five years (excluding the fiscal year that ended in January 2023 because it appears to be an outlier). Free Cash Flow was then discounted at the Weighted Average Cost of Capital calculated using the Capital Asset Pricing Model.
As per these calculations, the estimated present value of Lululemon Athletica Inc. is $70.15 billion or the equivalent of $579.35 per share of $LULU.
Risks
Overestimating growth
One of the most fundamental assumptions I have taken, that separates me from Wall Street analysts’ consensus estimates is the growth rate in revenue. I’ve assumed 10% for next year, and 24% for the years after that, compared to analyst consensus estimates of 13-14% growth. If I were to change the growth rate to 20%, 15%, and 12% then we’d get fair-value estimates of $554, $525, and $508 respectively.
If Lululemon’s Power of Three x2 growth strategy is not successful in meeting the management’s targets, then that will have a large impact on the fair value estimates of the company’s stock. This could be factors such as issues with the supply chain, or value chain as was during COVID of which a new strain seems to be surfacing. There may also be another competitor that comes up offering a similar quality of goods for more attractive prices, which may result in the company losing some market share.
However, keeping in mind the current rate of growth which has been mentioned in the catalyst section, I do not consider this threat to be a significant threat to my valuation model.
Declining Margins – Operating level
As can be seen from the valuations sections, I expect Lululemon Athletica’s operating margins to increase and revert to the long-term average. The underlying assumption was that the company would ultimately realize that its Sales, General and Administrative expenses have been growing as a share of its revenue and the company’s hand would be forced to reduce these expenses, or that technological advancements would enable the company to reduce employee headcount and limit its operating expenses. While general investments that the company is making relate to opening new stores and increasing brand awareness to explore growth opportunities, the ones that the company is making that will enable improvement in margins pertain mostly to upgrades in the Direct-to-Consumer network, IT Infrastructure and technology involved in the Supply Chain Network.
If operating profits are lower, then as per my model, operating cash flows will also be lower which will then result in lower free cash flows. This may also force me to reduce terminal growth rates. As a result, the fair value estimates for the company will also need to be revised lower significantly.
Additionally, some profit margins have been temporarily chipped off due to goodwill impairment. Expenses relating to impairment of goodwill decrease with time which will result in re-inflation of operating profit margins.
Conclusion
To conclude this report, I would like to place an Overweight recommendation on Lululemon’s stock as my fair value estimate of $579 presents a 13.5% upside to its closing price of $510 as of 22nd December. This reflects the catalysts – pricing power, growth in market share as well as international expansion.


