

- Gold price finds fresh demand early Friday as traders reposition ahead of US NFP data.
- Fed rate cut expectations and waning trade war fears keep US Dollar on the back foot.
- Impending Bull Cross on the 4H chart keeps Gold buyers hopeful.
Gold price is resuming its record-setting rally early Friday after taking a brief pause a day ago. However, Gold buyers stay cautious in the run-up to the critical US Nonfarm Payrolls (NFP) data release.
Will Gold price refresh record highs on weak NFP print?
All eyes now remain on the US labor market data, which will likely provide fresh insights on the scope and timing of the US Federal Reserve (Fed) interest rate cuts this year. The data is also likely to have a significant impact on the US Dollar (USD) and the US Treasury bond yields, eventually influencing the near-term direction in Gold price.
The US economy is seen creating 170,000 jobs in January after recording a stellar job gain of 256,000 in December. The Unemployment Rate is likely to remain at 4.1% in the same period. Meanwhile, Average Hourly Earnings are set to rise by 3.8% in January, compared to a 3.9% increase previously.
A smaller-than-expected increase in the headline NFP figure and slowing wage growth could indicate loosening labor market conditions in the US, reviving dovish Fed expectations and driving Gold price to fresh all-time highs close to the $2,900 threshold. In case of an upside surprise, markets will double down on the recent hawkish hold decision by the Fed, dialling down expectations of two Fed rate cuts this year.
The US Dollar will likely receive the much-needed respite from a potentially strong US payrolls data, initiating a corrective decline in Gold price.
The Greenback consolidates weekly losses heading into the main event risk for Friday – the US employment data, bearing the brunt of receding fears of a potential global trade war after US President Donald Trump’s pushback on Canada and Mexico for a month while markets look past the US-Sino tariff war, expecting no further escalation.
This has helped the USD-denominated Gold price hold near lifetime highs.
Gold price technical analysis: Four-hour chart
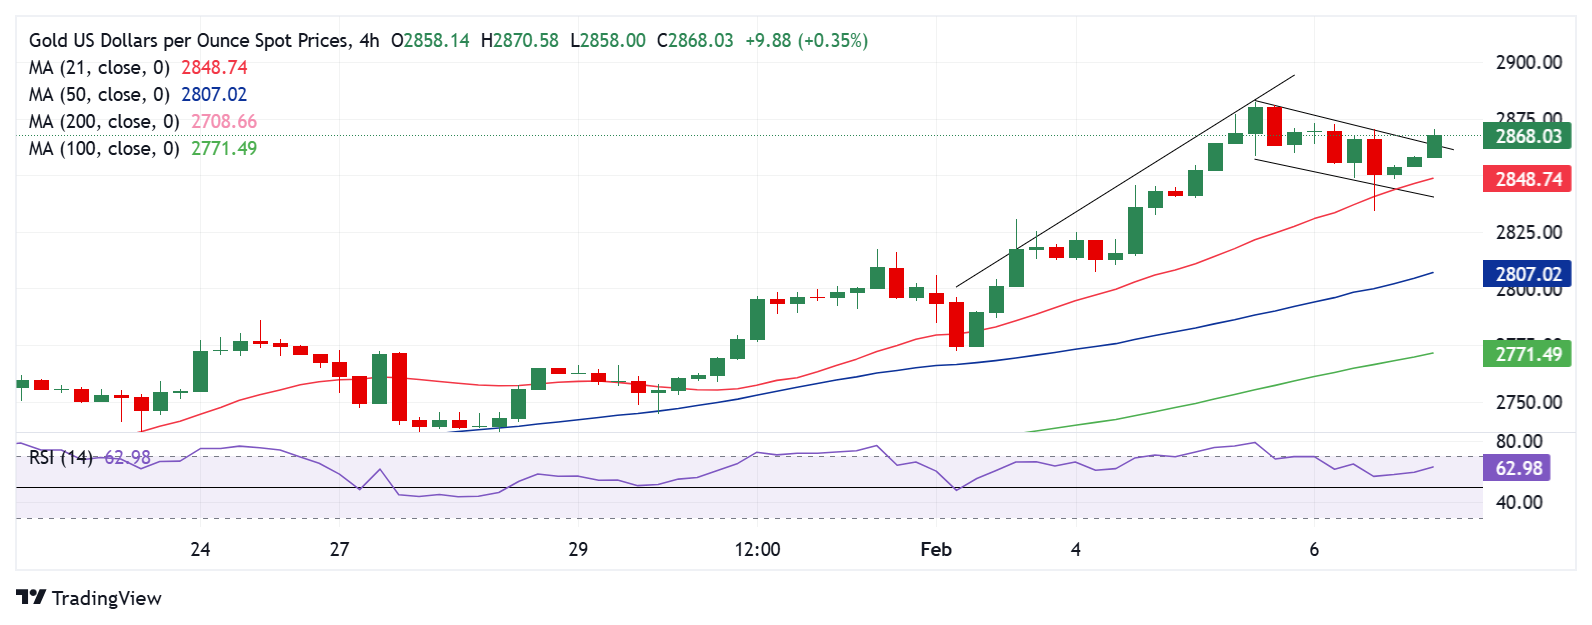
Gold price portrays an impending Bull Cross on the four-hour time frame. Gold buyers need a four-hour candlestick closing above the falling trendline resistance at $2,862 to validate the bullish continuation pattern.
If the further upside is confirmed, Gold price will retest the record highs at $2,882. The next relevant target is aligned at the $2,900 round level, above which the $2,95 psychological level will be tested.
The Relative Strength Index (RSI) points north while above the midline, currently near 63. The leading indicator remains supportive of the upside bias.
On the flip side, any retracement will meet the initial demand at $2,849, the 21-four-hour Simple Moving Average (SMA).
The falling trendline support at $2,826 will be the next cushion for Gold price, below which the $2,800 level will be challenged.
Economic Indicator
Nonfarm Payrolls
The Nonfarm Payrolls release presents the number of new jobs created in the US during the previous month in all non-agricultural businesses; it is released by the US Bureau of Labor Statistics (BLS). The monthly changes in payrolls can be extremely volatile. The number is also subject to strong reviews, which can also trigger volatility in the Forex board. Generally speaking, a high reading is seen as bullish for the US Dollar (USD), while a low reading is seen as bearish, although previous months’ reviews and the Unemployment Rate are as relevant as the headline figure. The market’s reaction, therefore, depends on how the market assesses all the data contained in the BLS report as a whole.
