
The market regime switched to ‘risk off’ in late February and early March (especially in the US). Currencies were caught up in that, as the dollar rallied. In particular, among the G10 currencies, the US dollar was particularly strong against the CAD; AUD; & the NZD. By early March, therefore, those currencies had given back all their YTD gains, with the Aussie dollar briefly dipping below its 50 day moving average (FIG B).
Since then the AUD has started to rally, and is attractive for 4 key reasons:
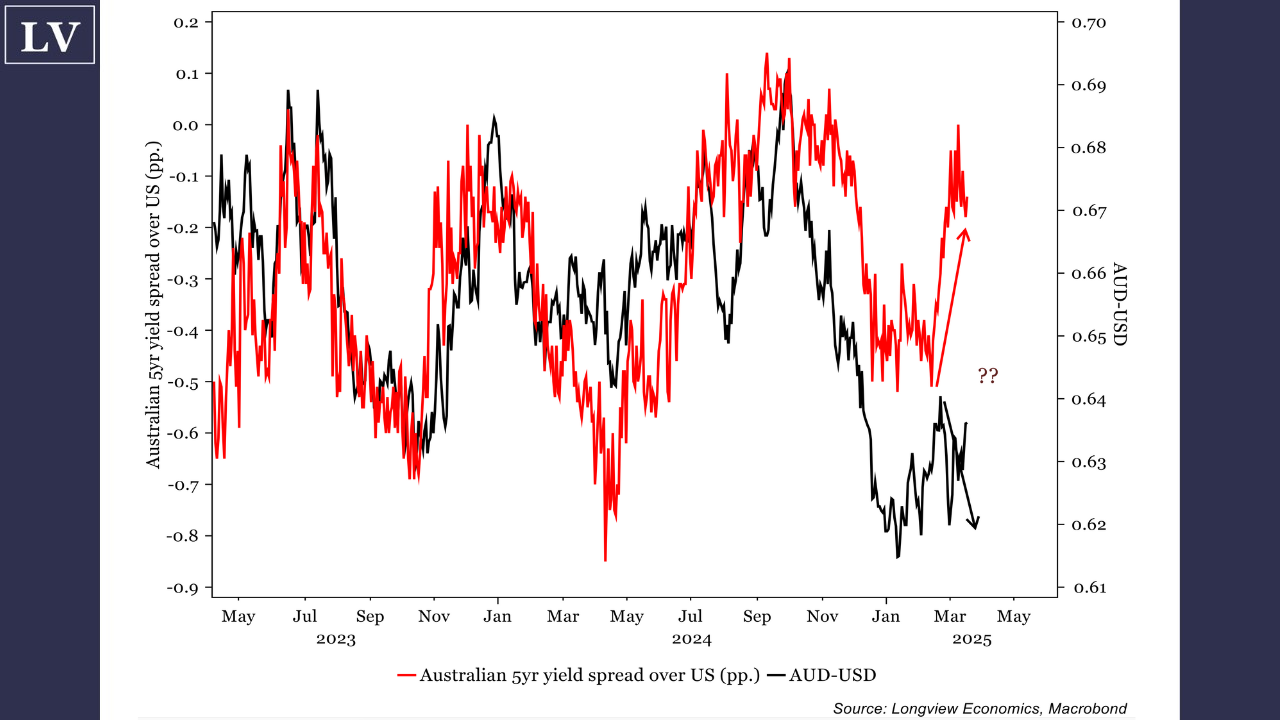
1. The RBA is likely to remain hawkish – yield support for the AUD remains strong (FIG C).
2. US and Australian growth outlooks are diverging (FIG A).
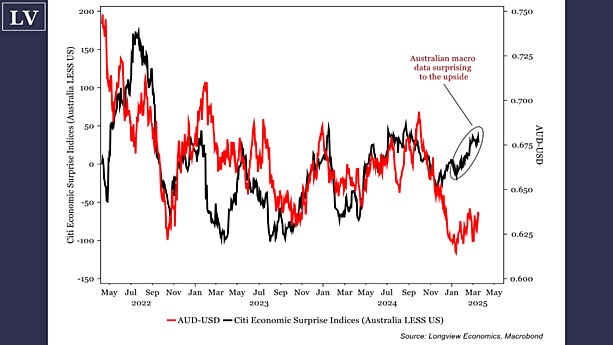
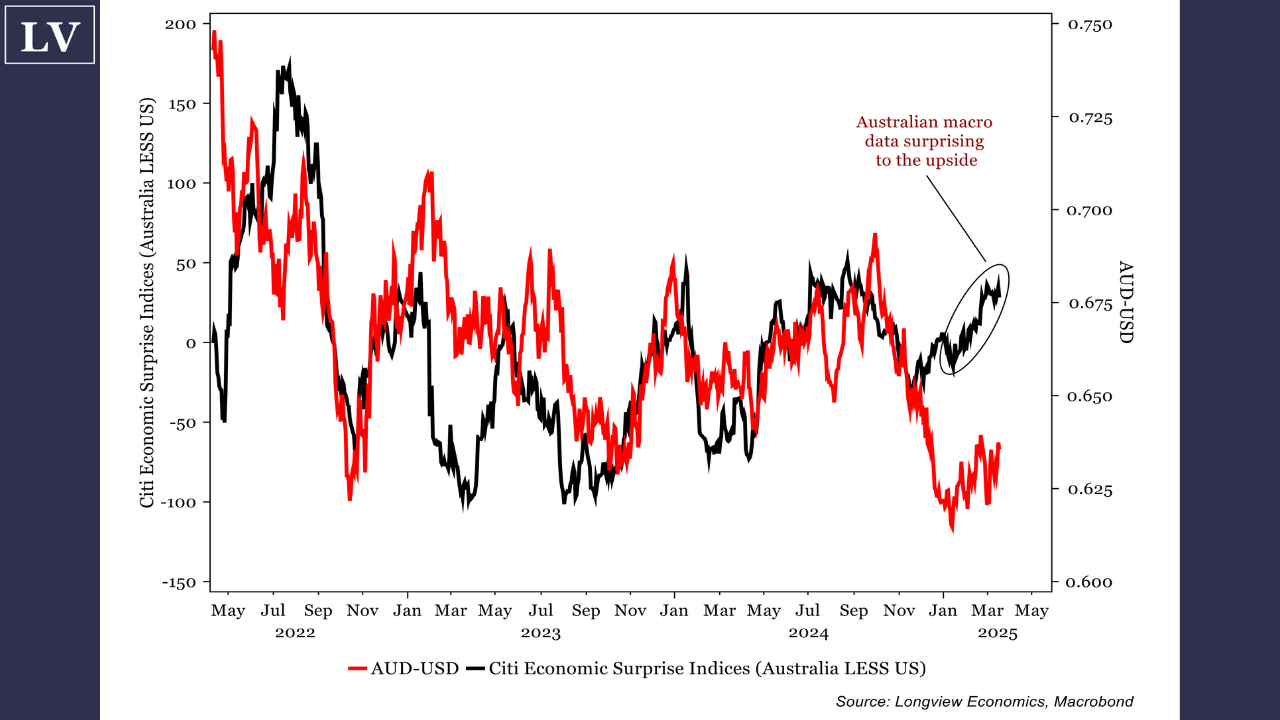
FIG A: Citi Economic Surprise Indices
(Australia LESS US) vs. AUD-USD
3. Plenty of ‘(Aussie) bad news’ is in the price.
4. Positioning and models are generating BUY signals on the AUD.
FIG B: AUD-USD futures candlestick with 50 & 200 day moving averages
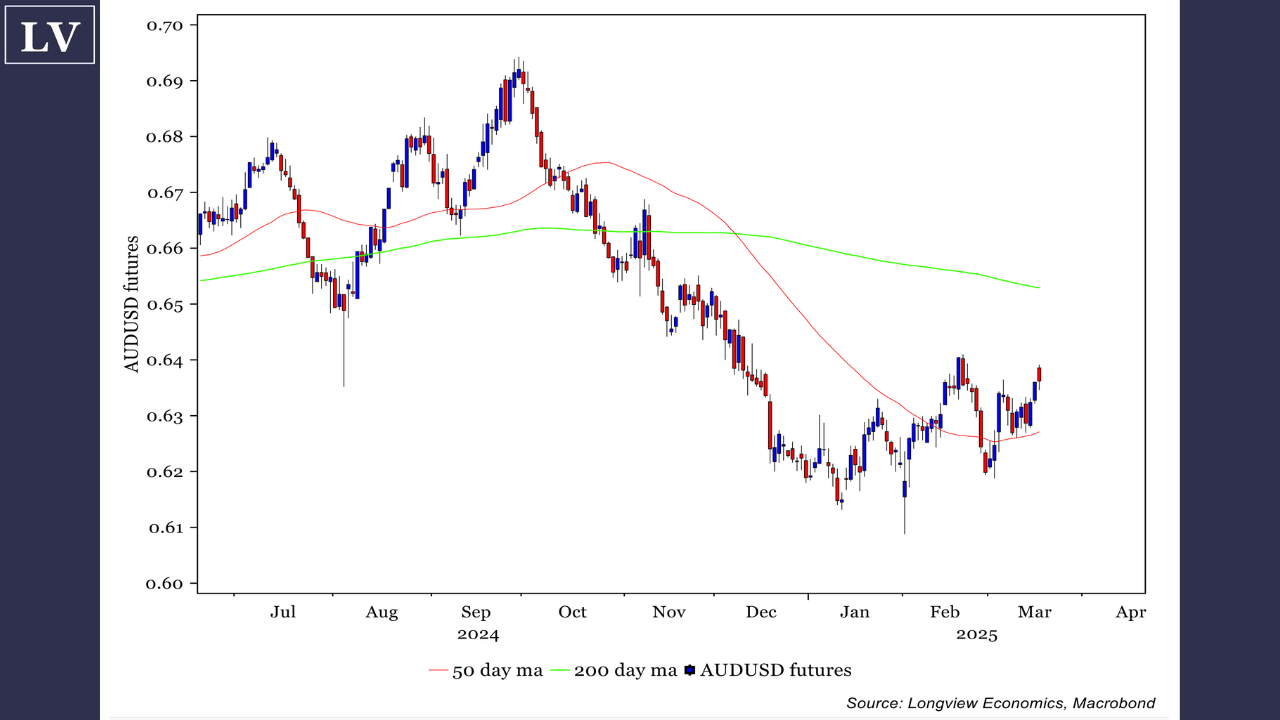
FIG C: AUD-USD vs. Australian 5yr yield
spread over US 5yr yields (pp.)
1. The RBA remains hawkish/slow to
cut rates.
So far in this loosening cycle, the RBA has only cut rates once (by 25bps in late February), compared to the cumulative 100bps of cuts from the Fed. Furthermore, it was a ‘hawkish cut’, with Governor Bullock pushing back on the markets’ view that the RBA will cut much more this year:
“The market is expecting quite a few more interest rate cuts in the middle of next year, about three more on top of this… …Our feeling at the moment is that that is far too confident” “…We cannot declare victory on inflation yet…”
Source: RBA Governor Bullock, February ’25 press conference, see ABC News article (available HERE)
FIG D: Australian consumer inflation expectations index (Melbourne Institute)
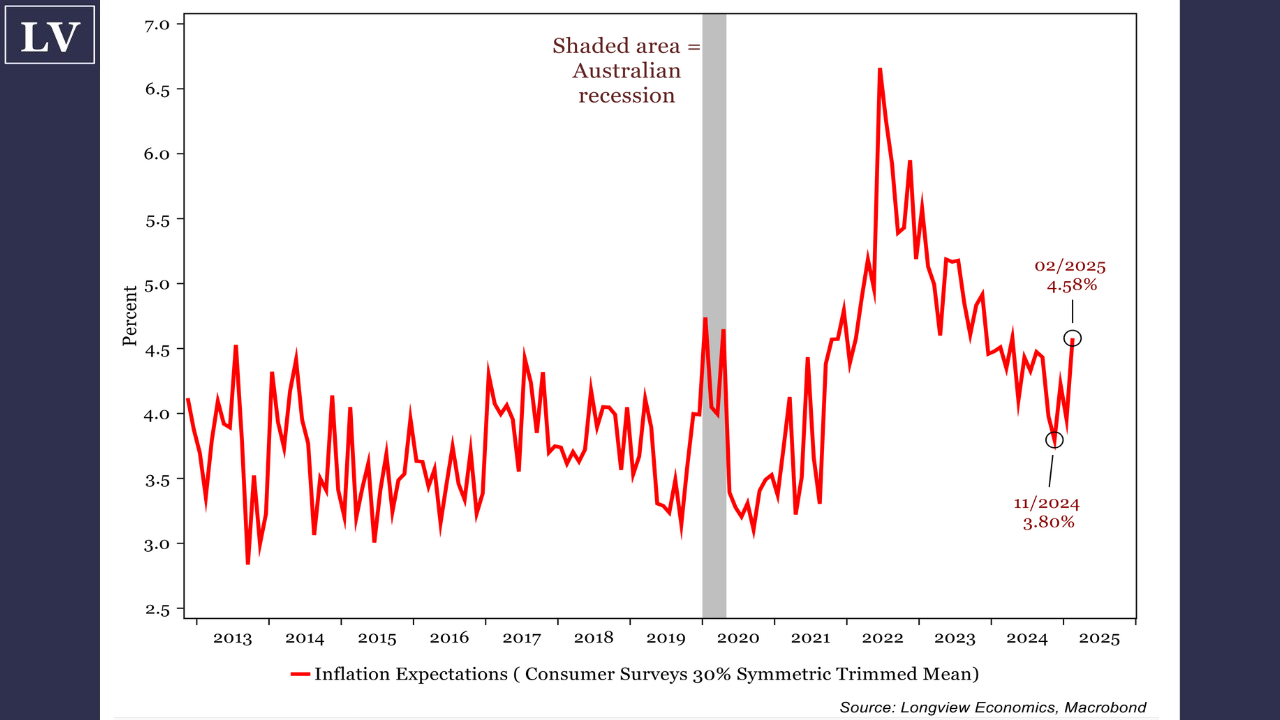
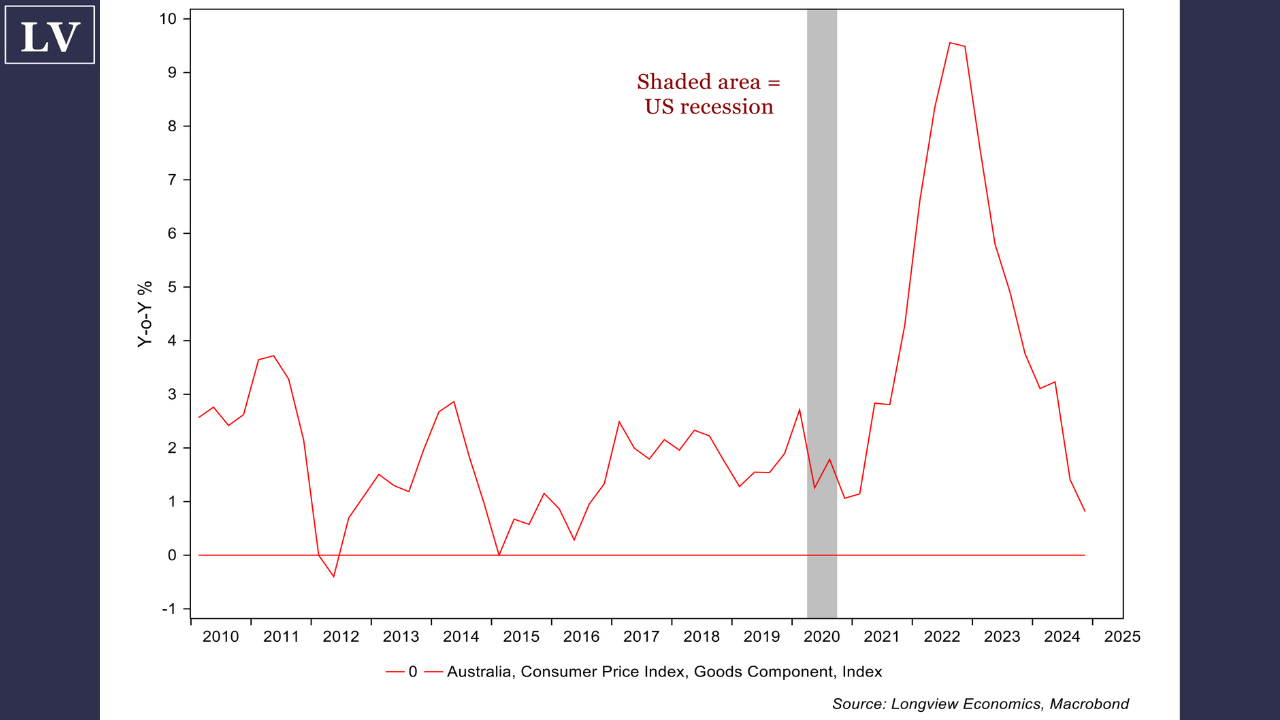
Their key concern is that domestically generated inflation remains sticky, given the tightness in the labour market (and, linked to that, sticky services inflation). The annual services CPI reading, for example, remains high (4.3% Y-o-Y, FIG J) while monthly readings have averaged 0.95% over the past three months. As such, and while goods inflation has been dissipating (FIG K), the RBA is likely to retain a hawkish stance (i.e. at least until the data turns). Yesterday’s inflation expectations data probably added to their conviction (as those expectations increased, FIG D). All of that suggests that Australian yields/rates are likely to remain elevated (for now) relative to US rates pricing (which we expect to continue to trend lower).
In other words, the RBA is looking to provide rates support for the currency (as part of its inflation fighting strategy – albeit it may not be explicitly stated).
2. US growth concerns are building
A tightening of US fiscal policy under Trump is exposing what we have labelled the ‘soft underbelly’ of US growth. That is, money has been tight in the US in the past 2 years, with the economy supported by fiscal policy. Under Trump, with the DOGE cutting government spending and with tariffs acting as a tax on consumers, growth has slowed sharply in recent weeks as fiscal policy has tightened. That’s evident, for example, in the US data which has been disappointing (see the Citi surprise index, FIG H), whilst the Atlanta Fed GDPNow real GDP estimate has collapsed (and is now pointing to a contraction in the economy for Q1 – see FIG E – albeit part of that is due to a spike in imports as businesses stockpile on imports ahead of tariffs).
FIG E: Evolution of Atlanta Fed real GDP estimate for Q1 2025
In contrast, the Australian data, despite various challenges, has surprised to the upside in recent weeks, as the economy has remained relatively robust. Given that divergence, the difference between the Australian and US Citi economic surprises has reached its highest level since last summer (FIG A). Historically, better than expected Aussie macro data (relative to the US), has been associated with AUD strength (and vice versa, see see FIGs A & H). In other words, the recent widening of the Aussie-US yield spread appears to be driven by ‘fundamental factors’. The giveback in the Aussie dollar, in contrast, appears to be driven by recent risk aversion in markets.
From a fundamental perspective, therefore, and given the stickier inflation backdrop in Australia (see point 1), the underlying trend in AUDUSD should be upwards.
3. Plenty of ‘bad news’ is in the
price.
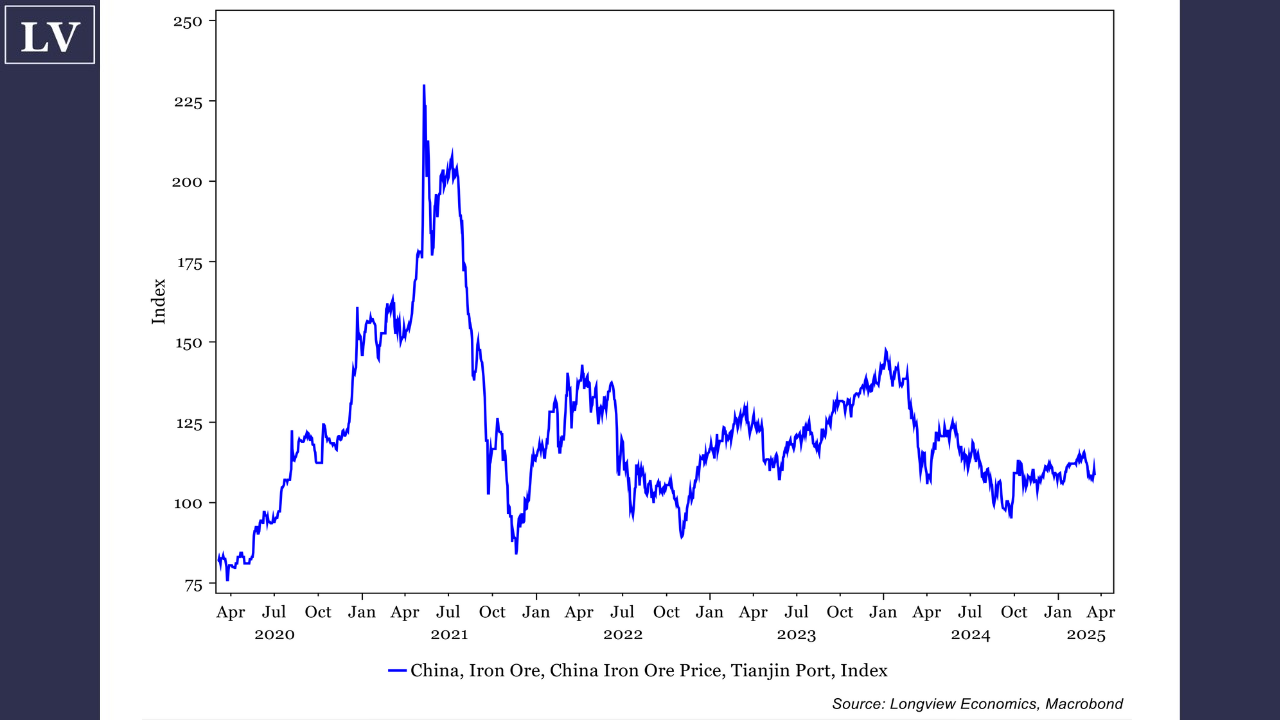
The AUD has trended down for the past four years (since its major local high in Feb 2021). It’s down 22% vs. the US dollar since then. That reflects a number of factors, including the bursting of China’s real estate bubble (from 2021 onwards), and the poor performance of the iron ore price.
That is, China has arguably experienced the largest asset price bubble in modern history. The bursting of that bubble has therefore been associated with weakness in several key ‘China-sensitive’ assets. In May 2021, for example, the iron ore price was trading at $227/ton. It’s currently trading at $101/ton (i.e. it’s down 56%, with most of that move in 2H 2021), FIG F. Other ‘bad news’ that is also now largely in the price (for now), includes the slowing of the Australian economy (e.g. with house prices now trending down in major cities).
The balance of risks, therefore, in terms of potential surprises, is now skewed to the upside. All eyes, in that respect, will be on this week’s ‘Two Sessions’ event in China (which is often used by the authorities to announce key policy decisions). A stimulus announcement, if significant (& if it happens), would probably provide fuel for a rally in the Aussie dollar, and other key China-sensitive assets. As always, it’s difficult to know what policy makers will do. Current expectations, though, are for more targeted policies to stimulate growth, financed with more issuance/a wider fiscal deficit (i.e. according to recent comments by China’s Finance Minister Lan Fo’an).
FIG F: SGX TSI iron ore futures price ($/ton)
4. From a positioning and models’
perspective, the AUD outlook is bullish
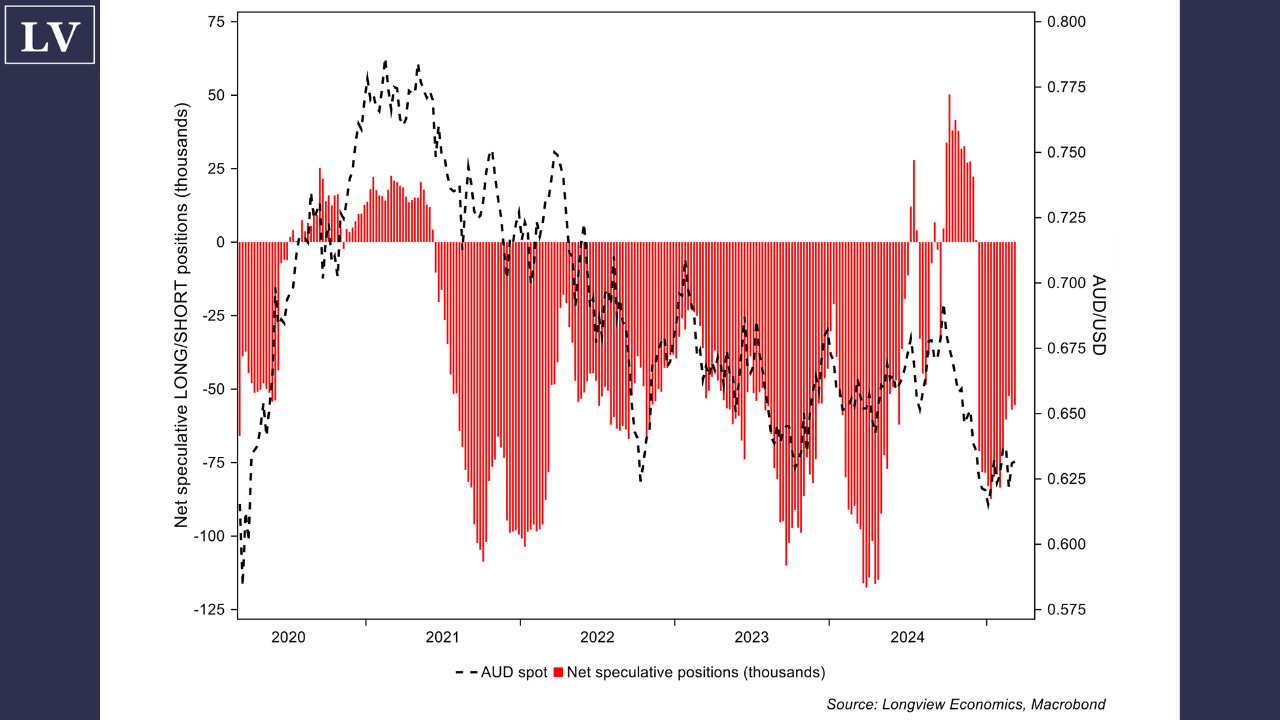
In particular, the market is currently net SHORT (FIG G). As such, and while short positions could be more extreme, there’s fuel for a rally in the currency (especially in the event of positive news flow – see point 3 above). The AUD is also technically oversold, with a number of short term models generating BUY signals. Other indicators carry the same message. In particular, general sentiment towards the dollar (DXY) remains notably bullish (and therefore generating a contrarian SELL signal for the dollar). As FIG I shows, dollar sentiment (for the DXY) is reasonably well correlated with the Aussie dollar.
FIG G: Net speculative LONG/SHORT positions in the AUD vs. AUD-USD
Risks, as always, are multiple, and include the possibility that the Aussie dollar is (continues to be) swept up in the current risk off regime in markets (that is, it remains disconnected to its ‘fundamental’ drivers, i.e. those related to economic growth, inflation, and government yield spreads).
FIG H: US & Australian Citi economic surprise indices
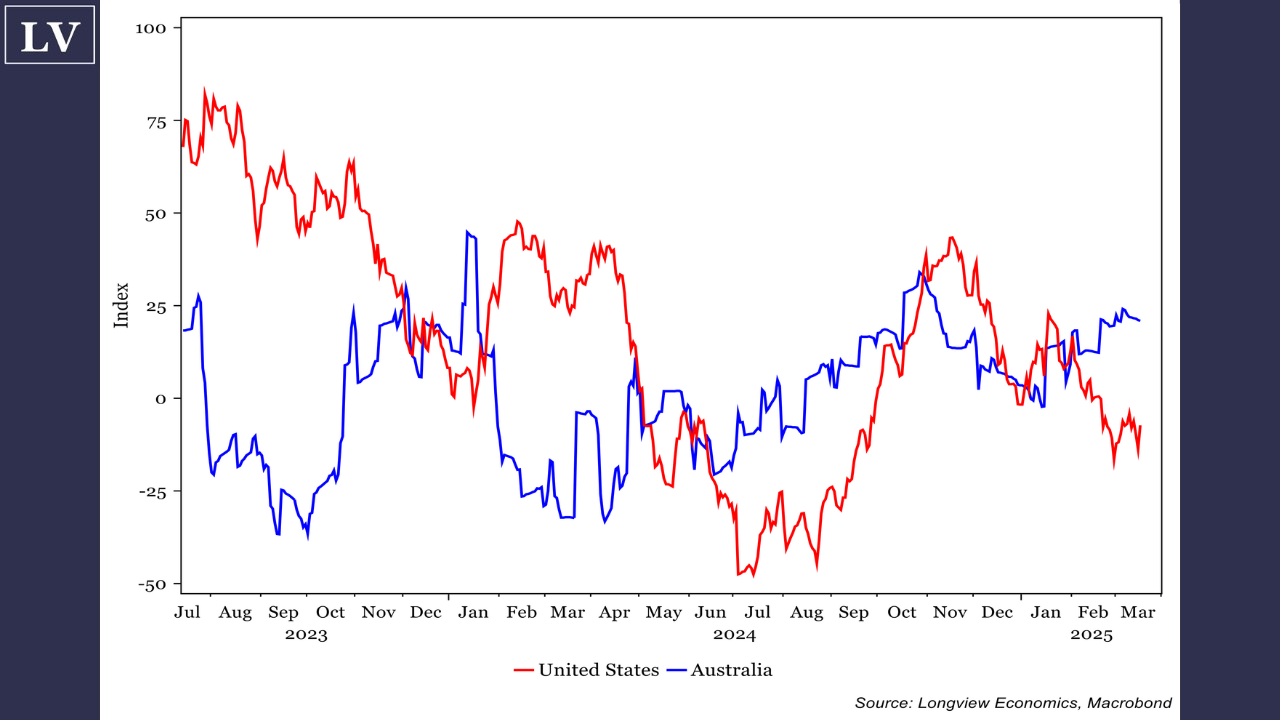
FIG I: US dollar index CONSENSUS Inc.* Sentiment
vs. AUD per USD
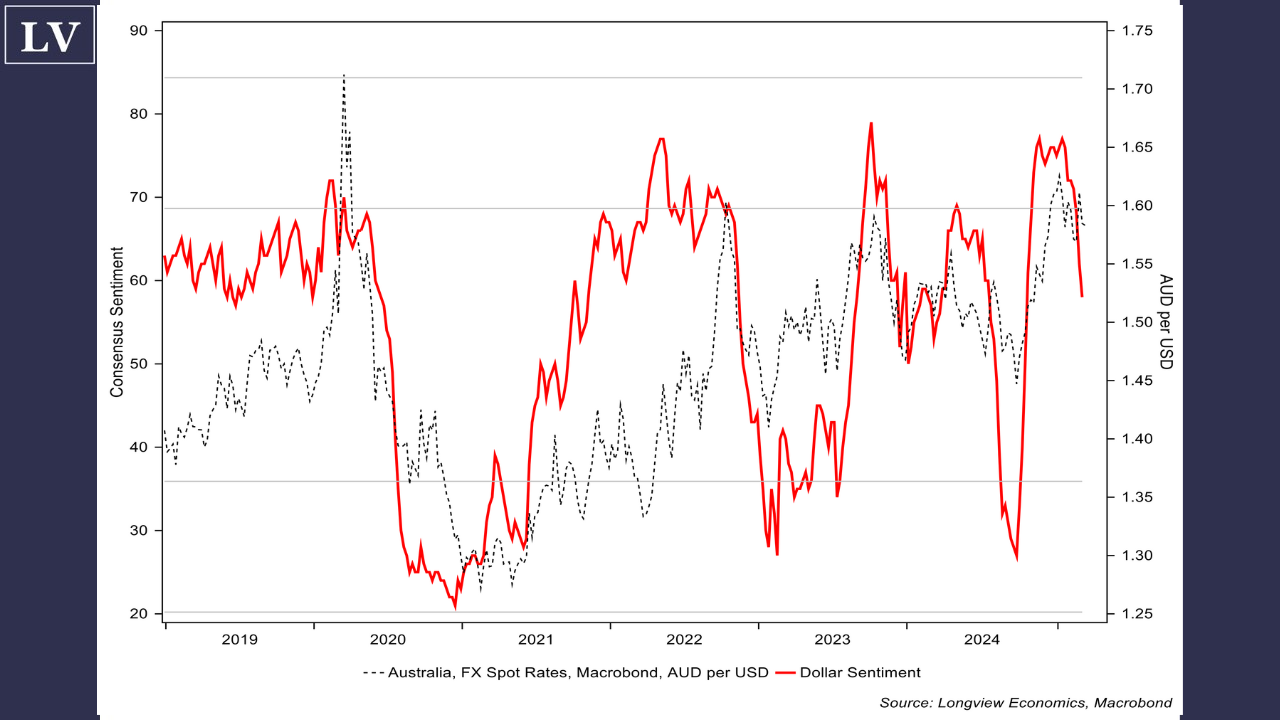
*CONSENSUS Sentiment Index created by CONSENSUS, Inc. and is based on market opinion published by brokerage house analysts and independent advisory services.
FIG J: Australian services CPI (Y-o-Y %)
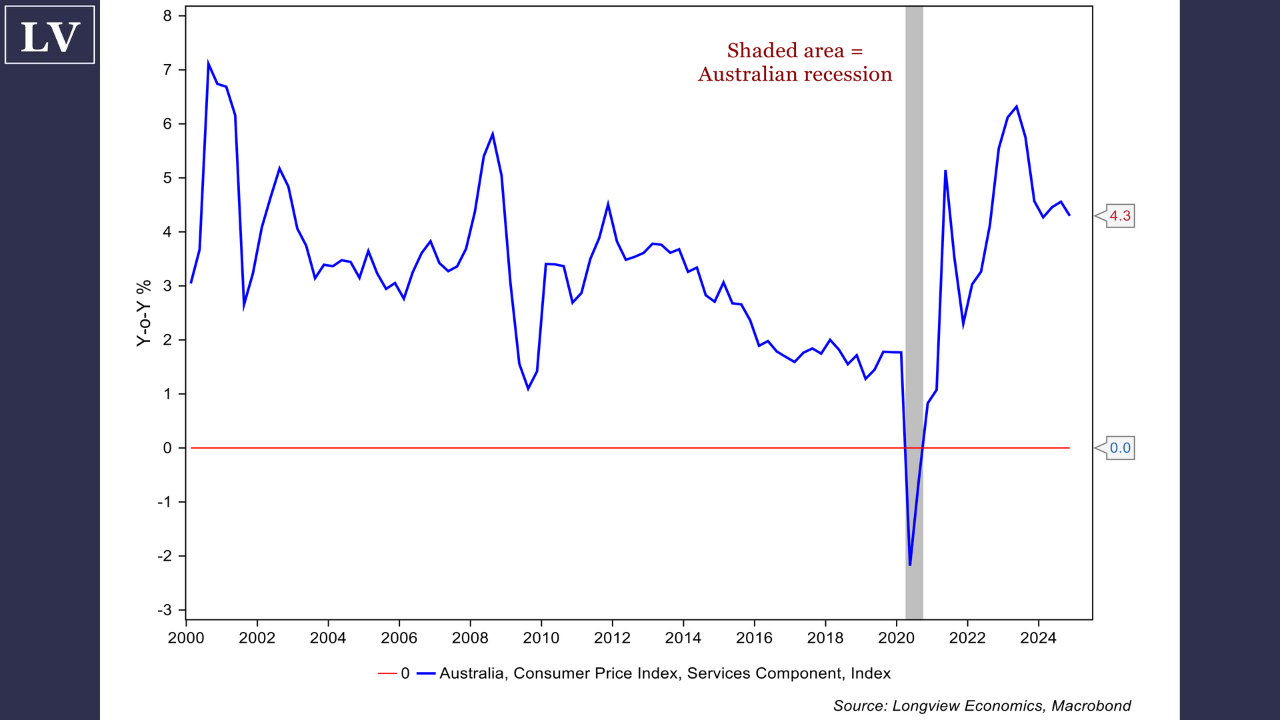
FIG K: Australian goods CPI (Y-o-Y %)
Never miss an update
Stay up to date with my current content by
following me below and you’ll be notified every time I post a wire


