

This report is designed to give you clear, actionable insights each week. It’s split into two parts:
-
Weekly thoughts – practical trading strategies, tips, and educational ideas to help sharpen your skills.
-
Setups & signals – our top 3 trade ideas for the week, complete with charts and key levels to watch.
Weekly thoughts
It’s not a big secret actually- I’m talking about crude oil!
In the final week of 2024, the team and I highlighted two versions of the WTI crude oil weekly chart and asked ‘is this the top trade of 2024?’
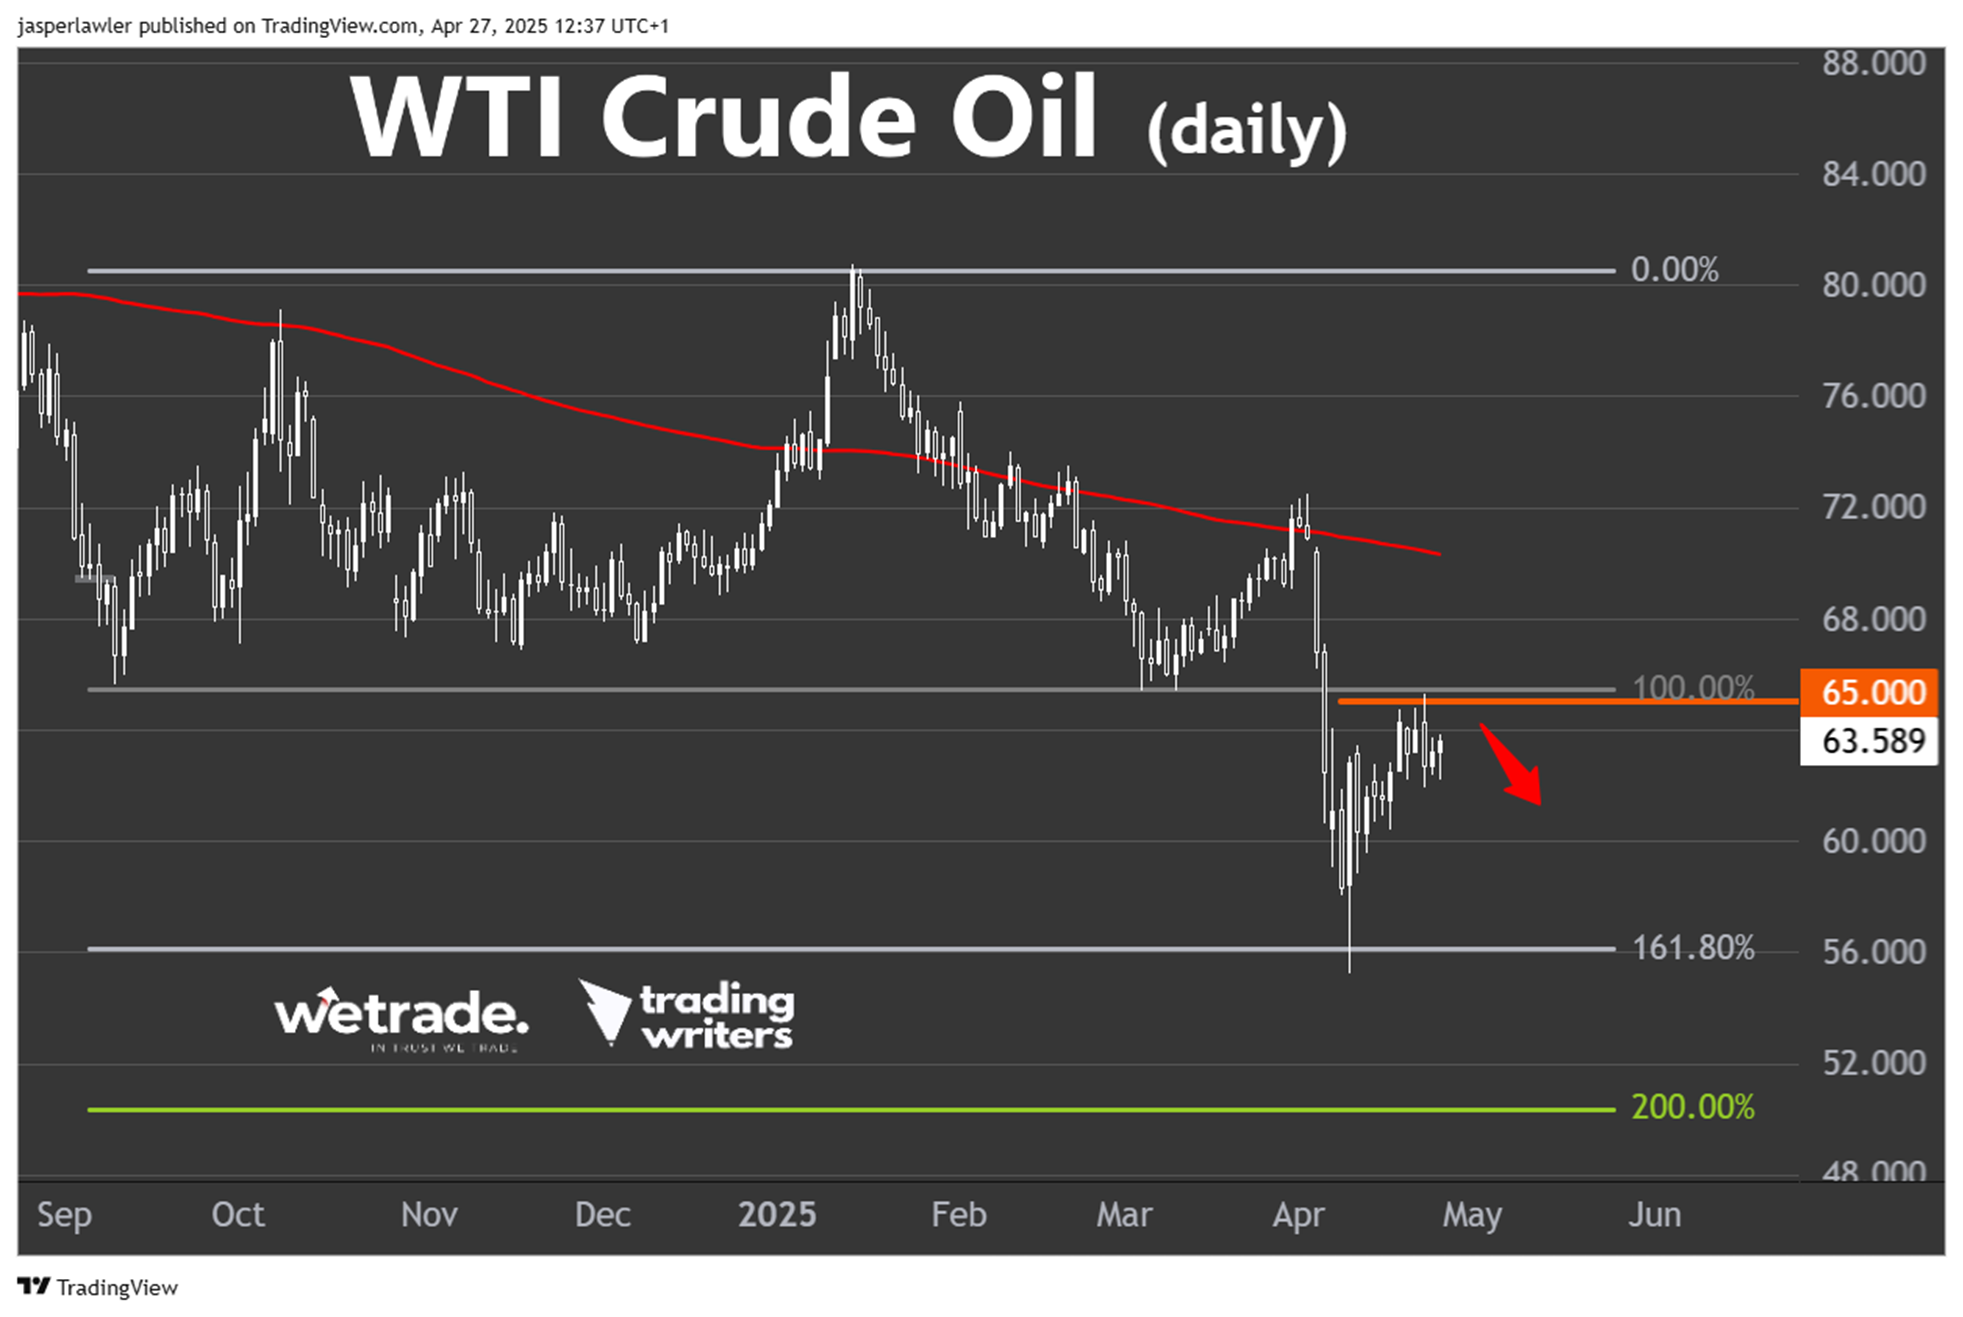
Version 1 has already happened, WTI crude hit $55 per barrel, the downside objective of the smaller triangle pattern on the chart.
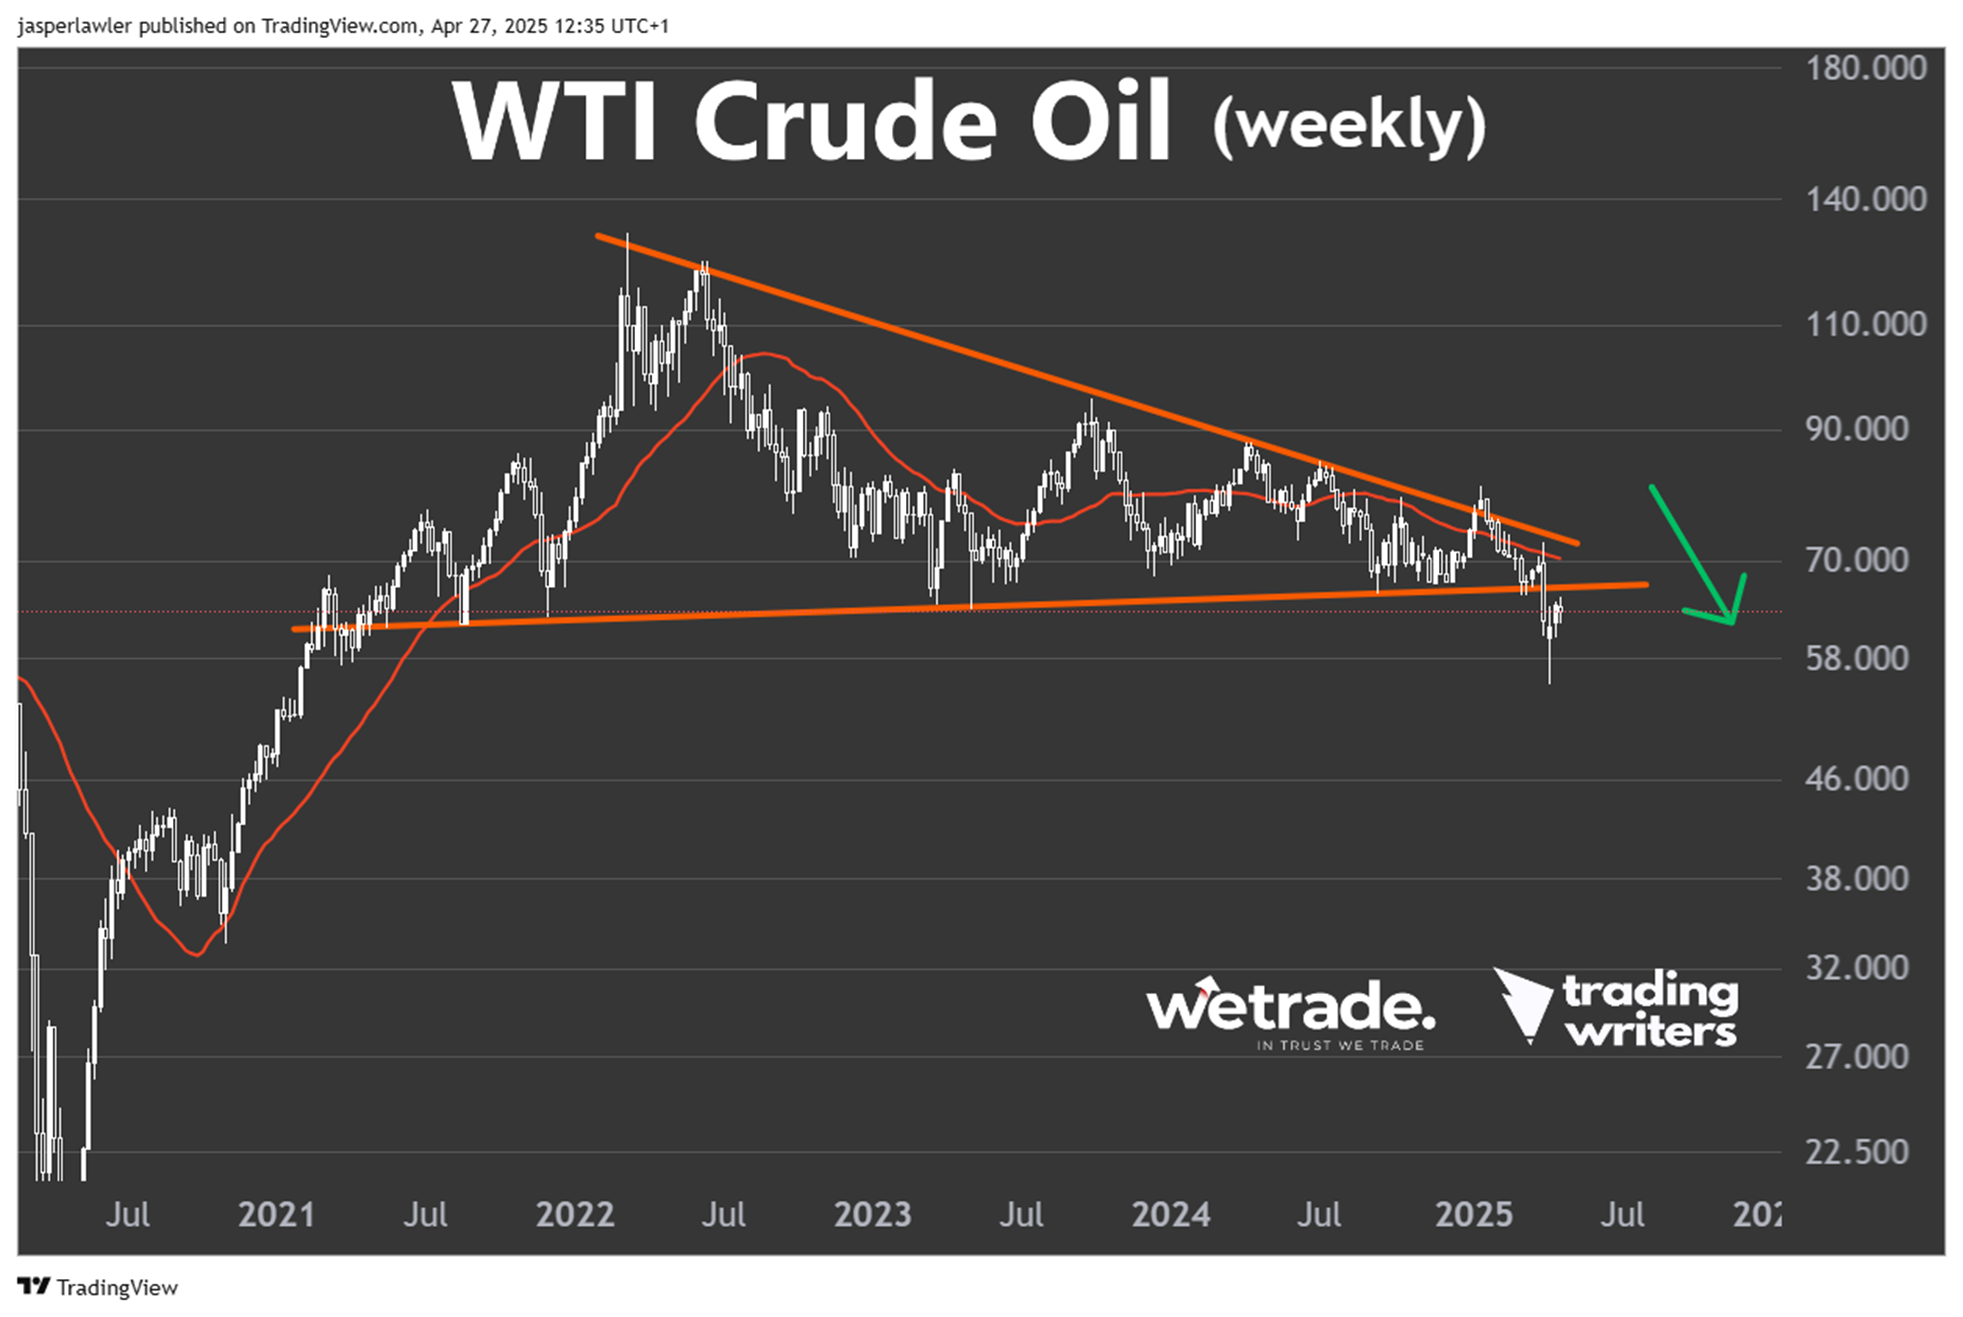
Version 2 showed a much larger triangle pattern (which we show again this week) and had a downside target of nearly $30! It would take a lot of conviction to ride the price that far down, but could crude oil still move a lot lower this year?
What’s interesting is that this is still one of the ‘less talked about’ situations in the market today because of the huge volatility seen in both stocks, forex and fixed income.
And I like that nobody’st talking about it – because you don’t want everyone in on it – that means the move could already be over.
Crude oil hit a five-year low. That’s meaningful.
Strong markets don’t hit 5-year lows, weak markets do. And we like to sell weak markets.
Of course, ‘oversold markets’ hit 5-year lows too – and that largely explains the ‘bottom feeders’ who bought WTI crude oil at $55.
Downside volatility got extreme owing to Trump’s tariffs and mean-reversion helped it rebound on news of the 90-day pause, much like stock markets.
I am completely open to the idea that $55 is a multi-year low and essentially marked the bottom. The huge Hammer reversal candlestick pattern adds weight to that idea.
But with the price having hit $65 last week, buying the lows is yesterday’s trade. What do we do today?
We will be looking to do what we said in Week 53 of 2024 in case crude oil turns out to be the ‘top trade of 2025’ as we imagined.
By the way, Brent crude oil has a very similar setup so this is not a ‘US oil’ thing.
There are two parts to trading ‘planning the trade, and trading the plan’.
There isn’t much use in making a plan, and not taking the trade.
There are always reasons not to take a trade- but if it’s a ‘good trade’ that fits the rules of your trading strategy, then those reasons are usually just ‘noise’.
Setups and signals
We look at hundreds of charts each week and present you with three of our favourite setups and signals.
WTI Crude (USO/USD)
Long term chart (weekly).
Trend: Down.
Phase: Re-test of breakdown.
Resistance = $70.
Support = $55.
Price action: Price has broken down, rebounded and is now testing the breakdown level, while under the 30-week moving average. Should the price break back over the broken long term rising trendline then we know the idea, or at least the timing on the idea is not right.
View: Bearish while under broken up-sloping long term support.
Medium term chart (daily).
Trend: Up.
Phase: Getting parabolic.
Resistance = 3400.
Support = 3000.
Price action: Following a dip under $3000 and its 30-day moving average, gold thundered higher to hit multiple record highs last week. There is bearish divergence with higher highs in price being matched with equal highs on the RSI.
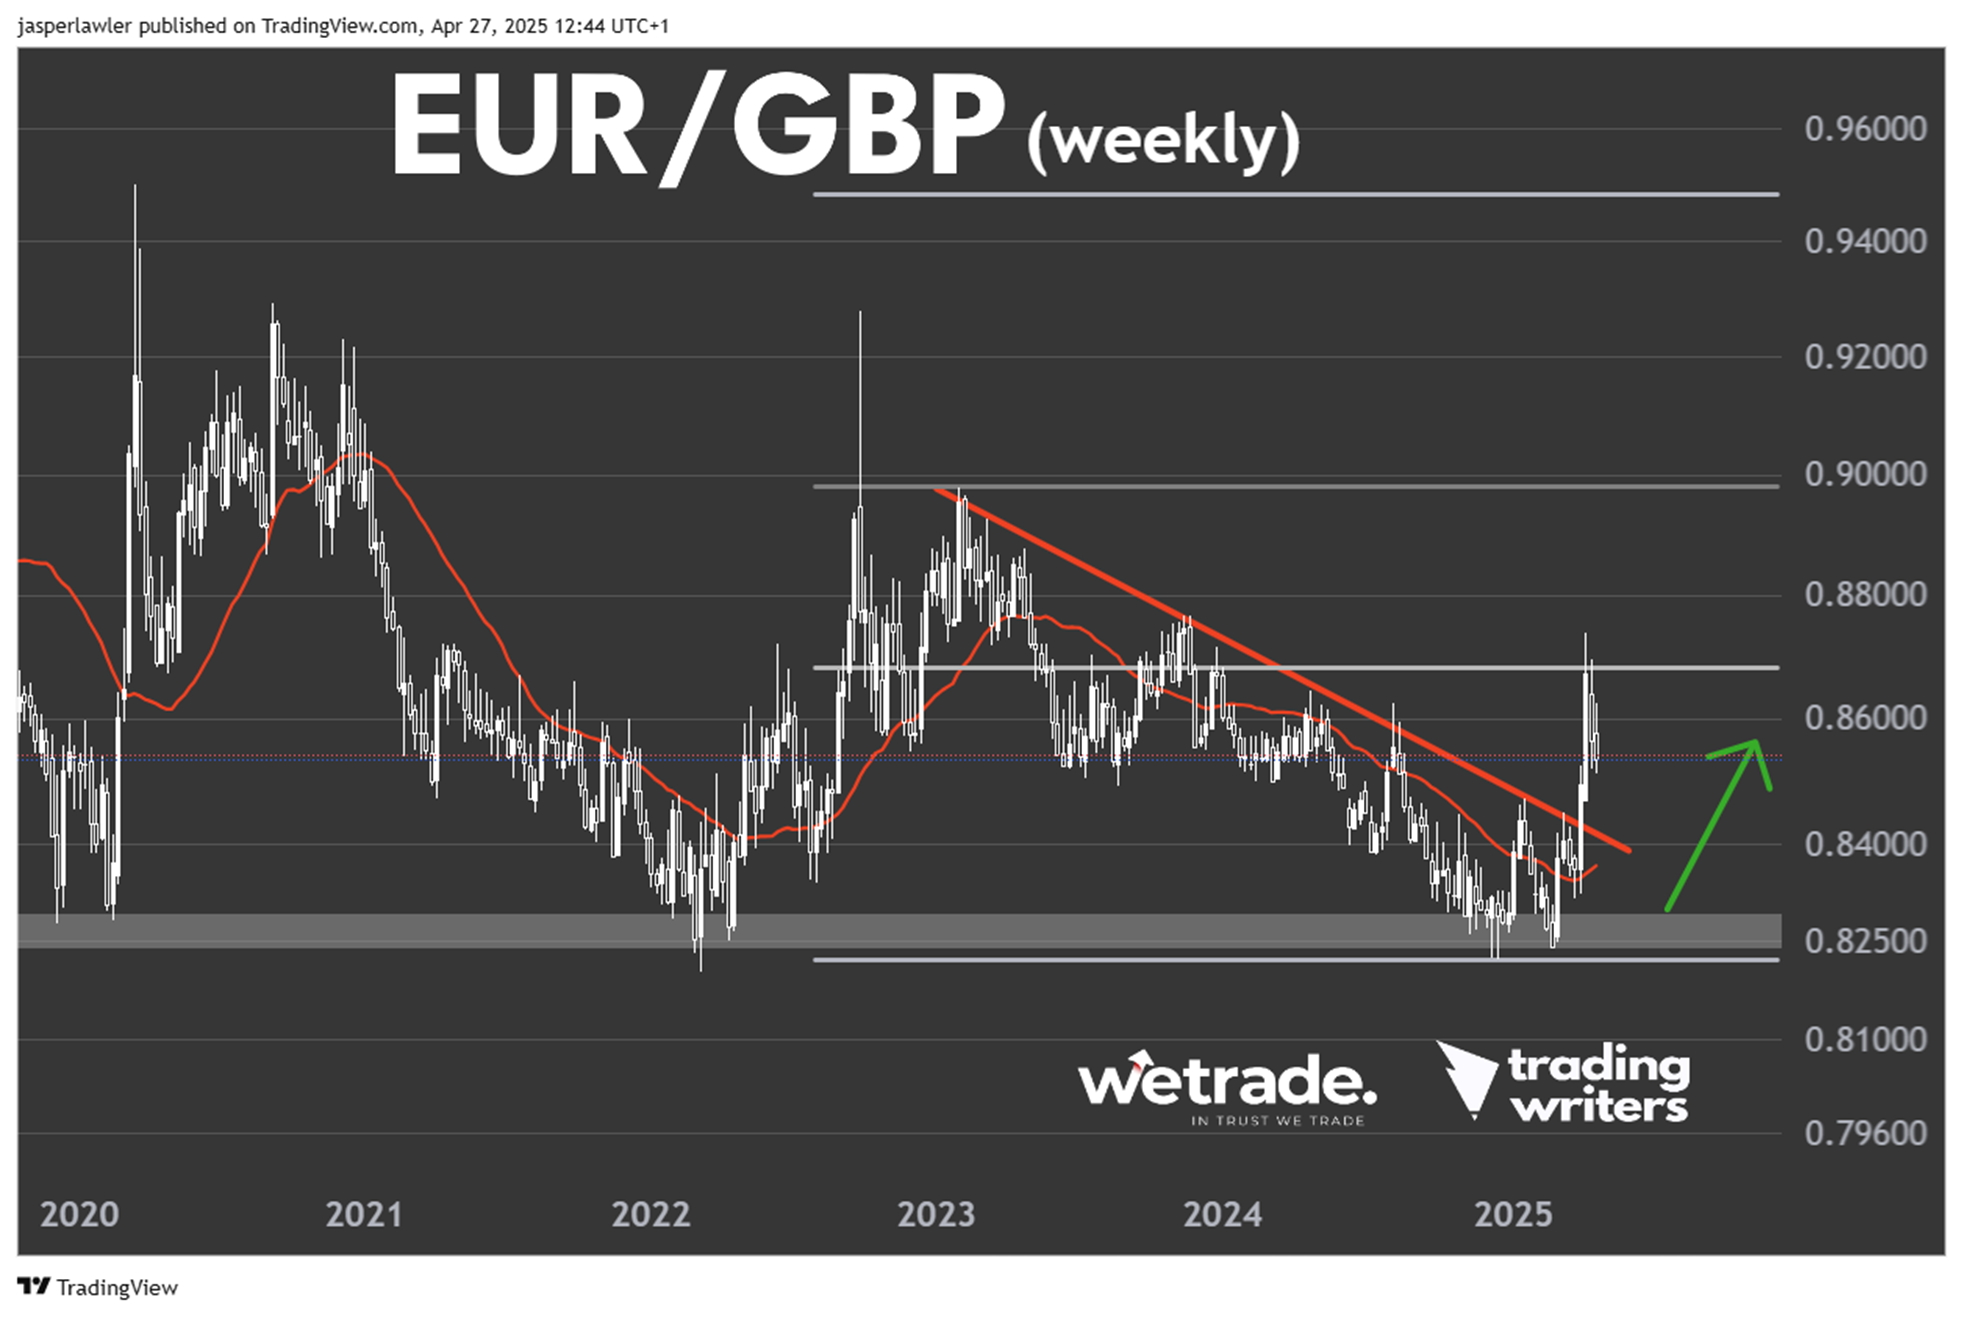
EUR/GBP
Long term chart (weekly).
Trend: Up.
Phase: Trendline breakout.
Resistance = 0.90.
Support = 0.8250.
Price action: The price has pulled back significantly from its initial surge that took it above the rising trendline and is now back in a ‘value’ area for possible dip-buying on the basis that long term support has held and the uptrend will continue.
View: Bullish while above the broken trendline.
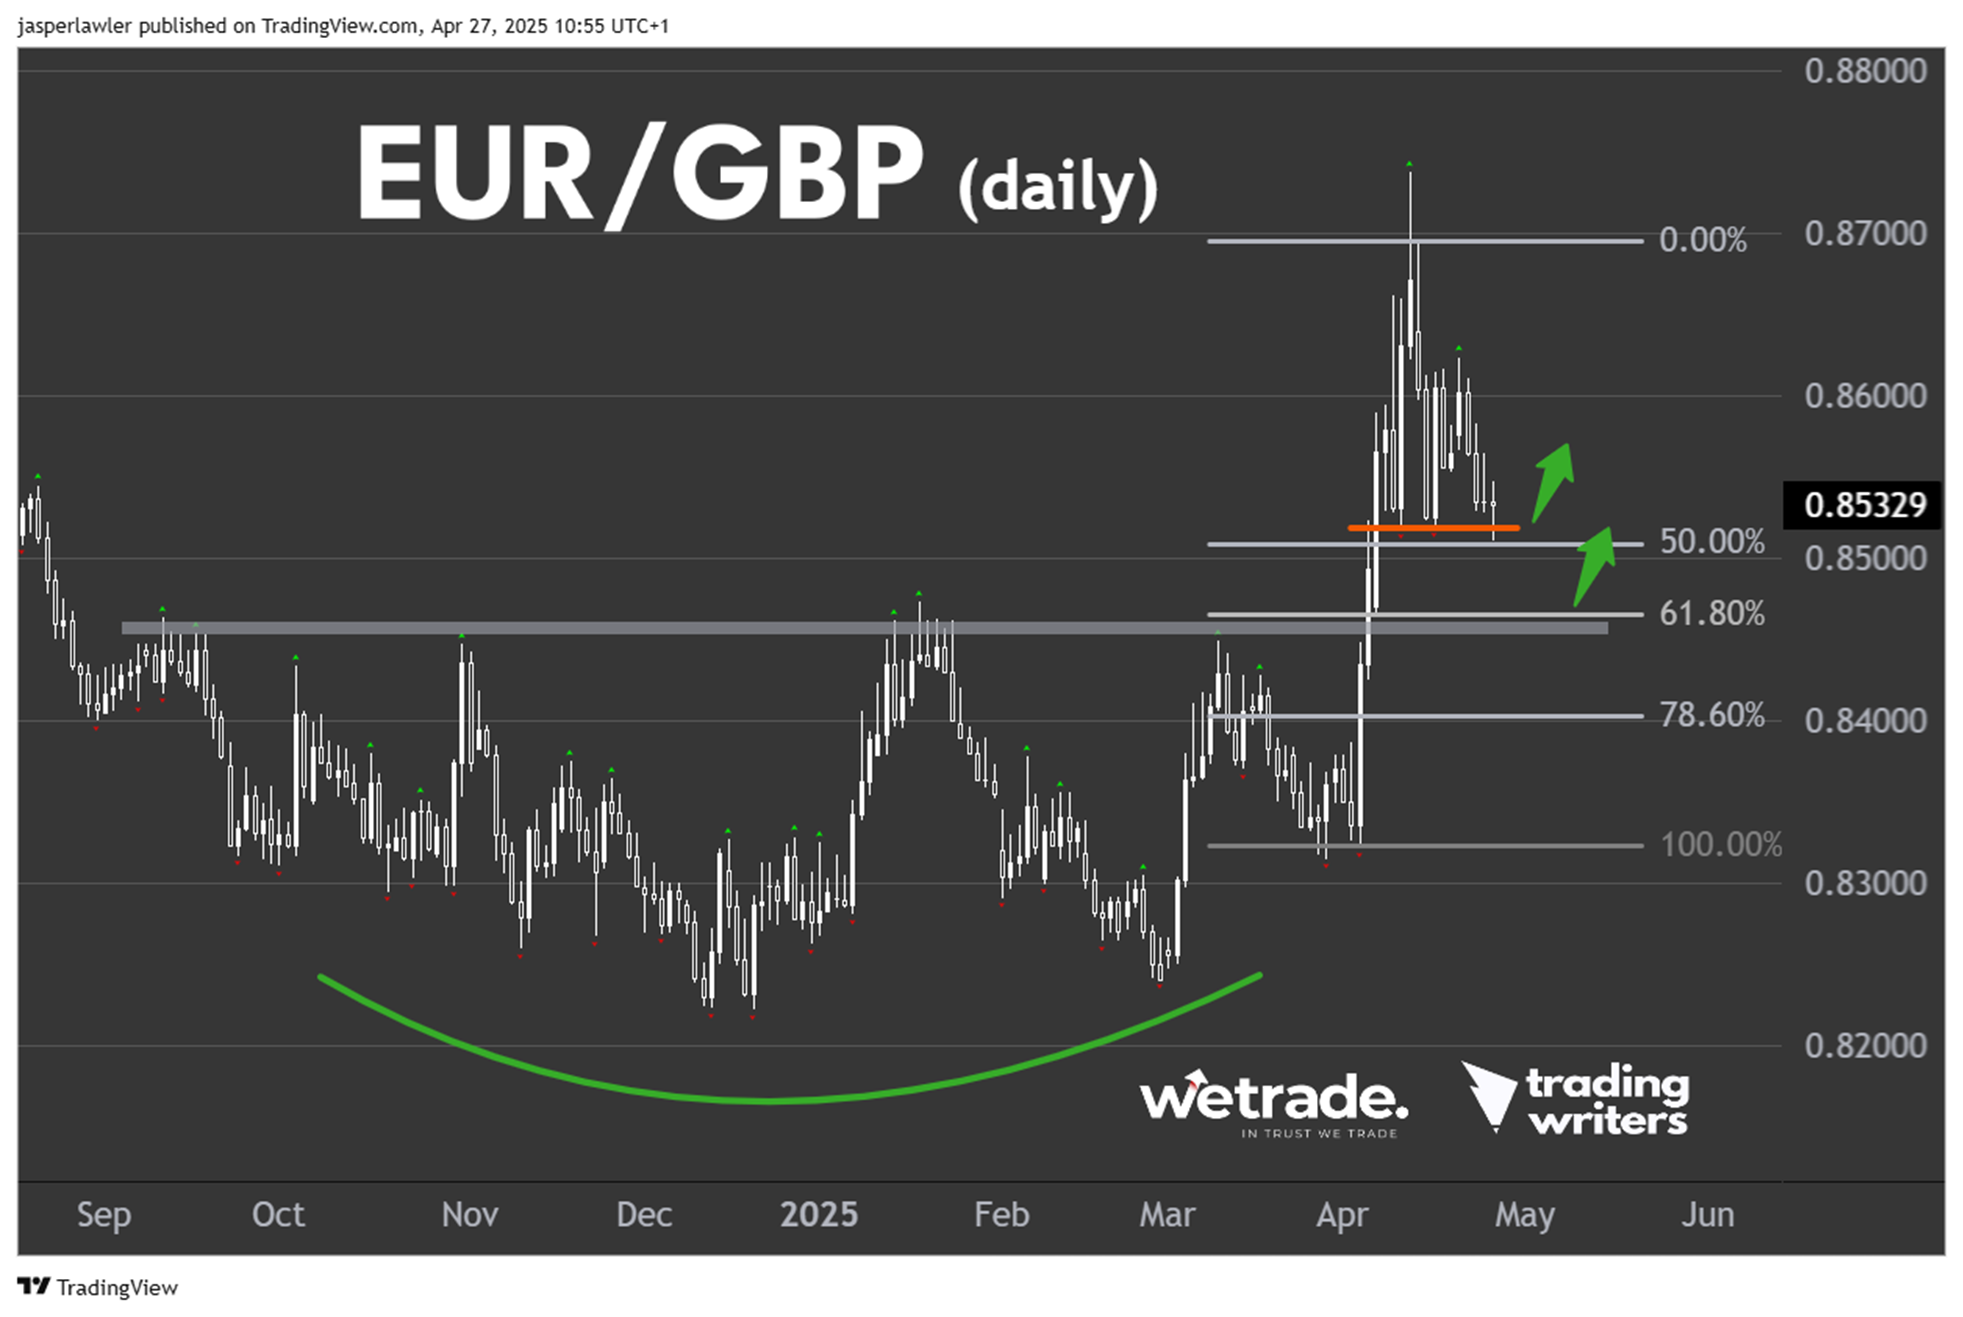
Medium term chart (daily).
Trend: Up.
Phase: 50% retracement.
Resistance = 0.87.
Support = 0.8450.
Price action: The price has dropped back from its spike high and is consolidating above the 50% retracement level. Either here, or the broken resistance / 61.8% retracement level could offer the opportunity to rejoin the breakout.
Bitcoin
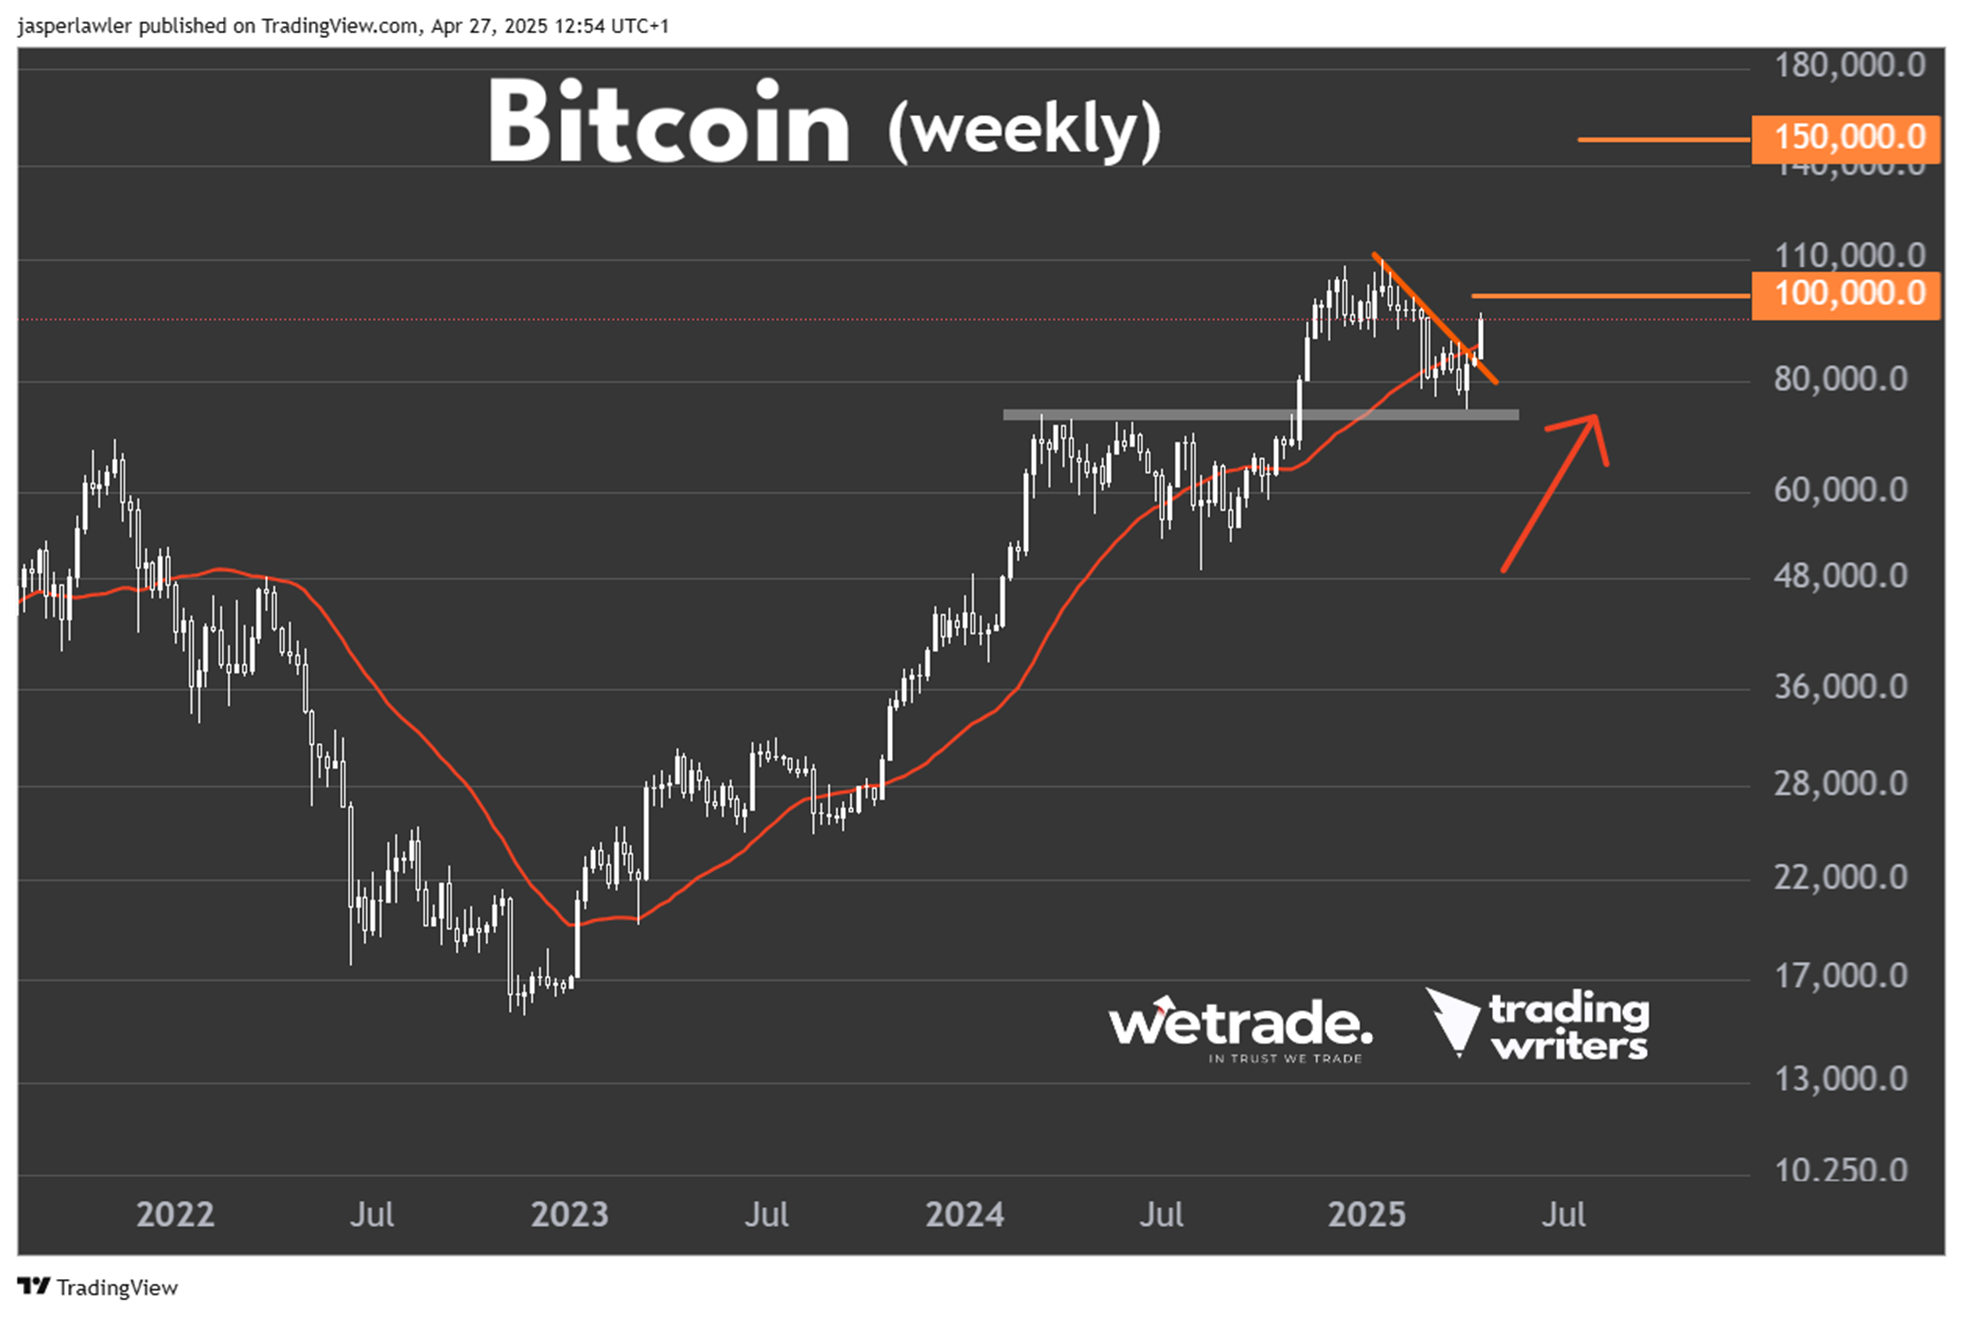
Long term chart (weekly).
Trend: Up.
Phase: End of correction?
Resistance = 110,000.
Support = 75,000.
Price action: Bitcoin has pulled back in a relatively orderly move to the former high (March ‘24) and has rebounded back over the 30-week moving average with the break over a short-term down trendline.
View: Bullish while over $75,000.
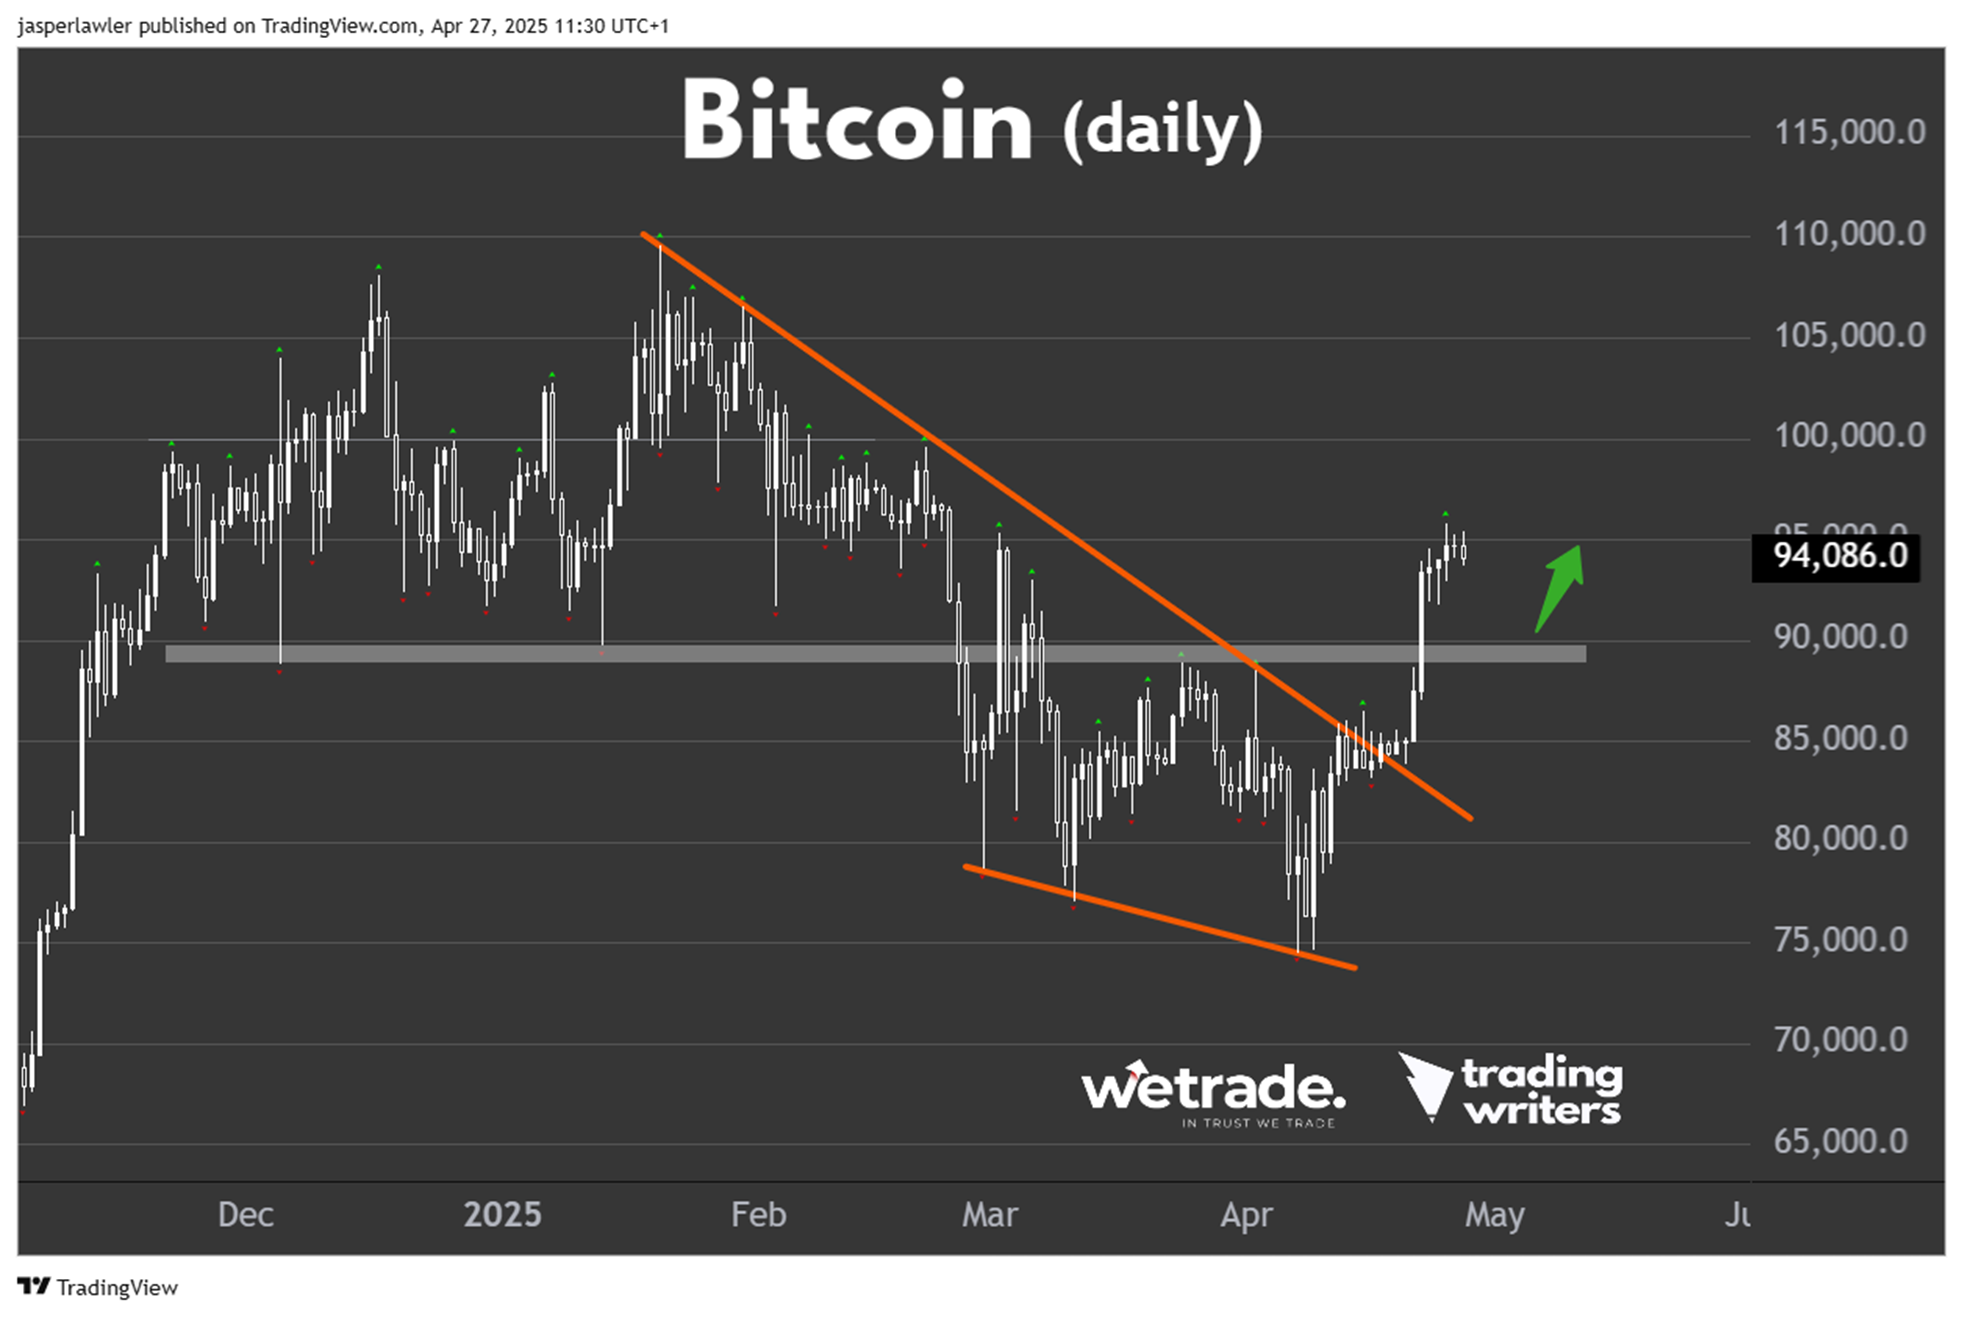
Medium term chart (daily).
Trend: Sideways.
Phase: Possible trend reversal.
Resistance = 100,000.
Support = 90,000.
Price action: The price has broken back over the key 90,000 level, having also broken out of a falling wedge pattern. The price sits in the middle of what is now a large $35,000 range but holding the 90K level suggest a move to test the top of the range.


