
With the S&P 500 (SPY) and Nasdaq 100 (QQQ) showing signs of rolling over again, potentially revisiting their April lows, many investors are frozen. But this isn’t a time to panic. It’s a time to sharpen your edge.
And in this market, fundamentals won’t help you.
Earnings season has made one thing clear: CEOs and CFOs have no idea what’s coming in the next six to twelve months. Macro uncertainty is off the charts, and the data is changing daily.
That’s why I keep hammering the same point: now is the time to focus on technical analysis—not fundamentals.
Why Technicals Matter More Than Ever
Fundamentals are like trying to fly a plane with your eyes. They work in clear weather—when the market’s stable and predictable. But that’s not where we are now.
We’re in the clouds. Visibility is gone. That’s why we fly with instruments.
Technical analysis is the investor’s instrument panel. It doesn’t get foggy or emotional. It’s based on real-time price action. That makes it ideal for navigating volatility.
Indicators like the 50-day and 200-day moving averages give us critical information about momentum, support, and trend direction. And unlike arbitrary timeframes, these moving averages are watched by millions of traders, which gives them power. Price reacts because people act.
The Two Moving Averages You Need to Watch
The 50-day moving average is a short- to mid-term trend indicator. When a stock is above its rising 50-day MA, it has about a 67% chance of closing higher the next day. That trend flips bearish when the 50-day is sloping downward.
This “technical rule” can be used effectively on stocks, ETFs and market indices.
The 200-day moving average is even more important for identifying long-term trend direction. It acts as a litmus test: stocks above a rising 200-day are in long-term uptrends; below a declining one, they’re in a downtrend.
Right now, only 190 out of 515 stocks in the S&P 500 and Nasdaq 100 are trading above both a rising 50-day and a rising 200-day moving average.
That’s just 37% of the market. The rest? Either in downtrends or stuck in trendless limbo.
That 37% is where your focus should be. These are technically strong stocks. They’re outperforming the market during uncertainty—and they’re where new leadership is forming.
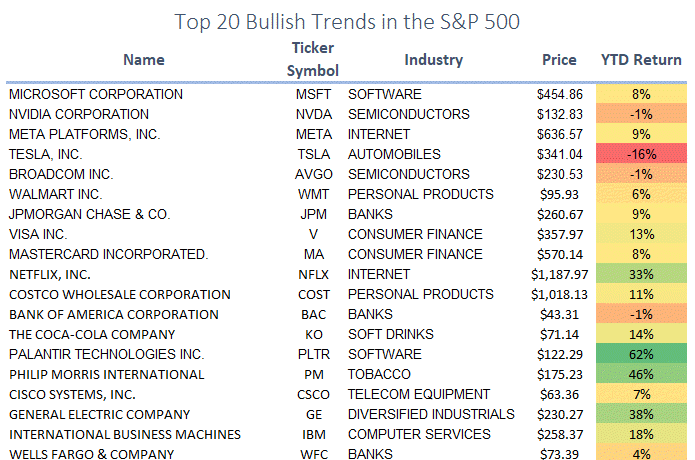
Here are the top 20 stocks that meet this test:
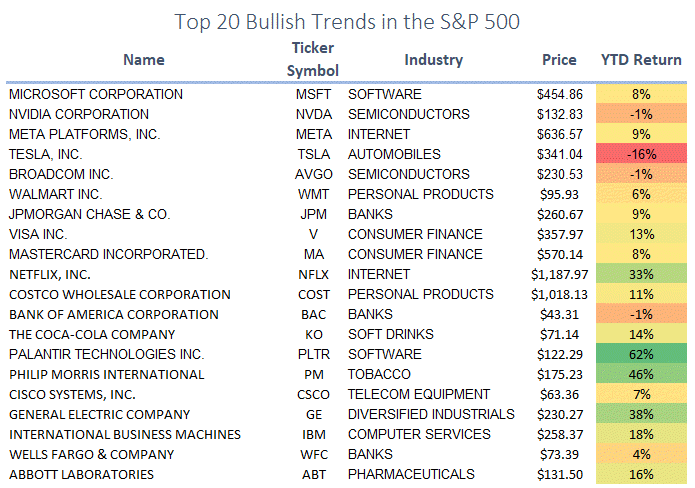
Some of these stocks are speculative. Others are slow and steady. But they all have one thing in common: they’re outperforming.
Here is the list of all 190 stocks trading above their bullish 50- and 200-day moving averages.
Five Bullish Trend Standouts
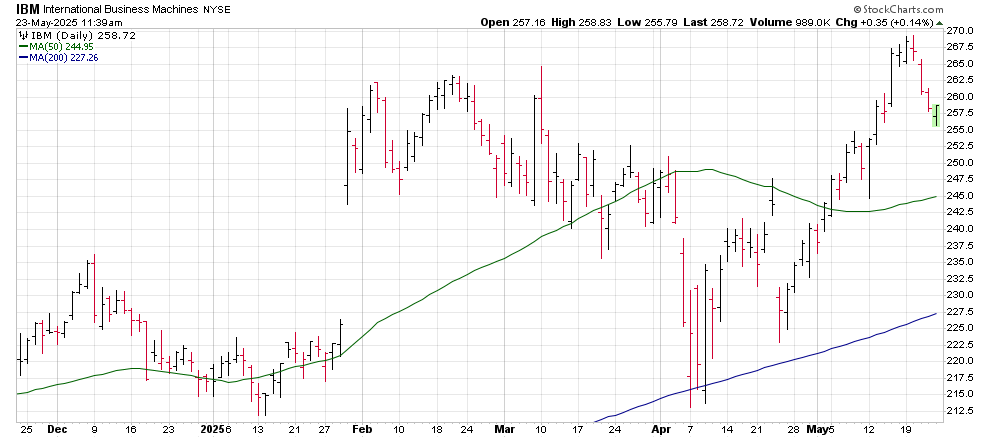
IBM
IBM has emerged as a surprising winner in the AI and automation revolution. The stock is in a bullish long-term trend and recently bounced off support. As businesses tighten budgets, IBM’s enterprise software and consulting services make it a safe, tech-heavy pick.
IBM is also one of the underappreciated stocks in the AI Service industry, expect that to change. As a kicker, IBM is also one of the larger – and slower – players in the up-and-coming quantum computing industry.
Outlook: Bullish
Target Price: $300
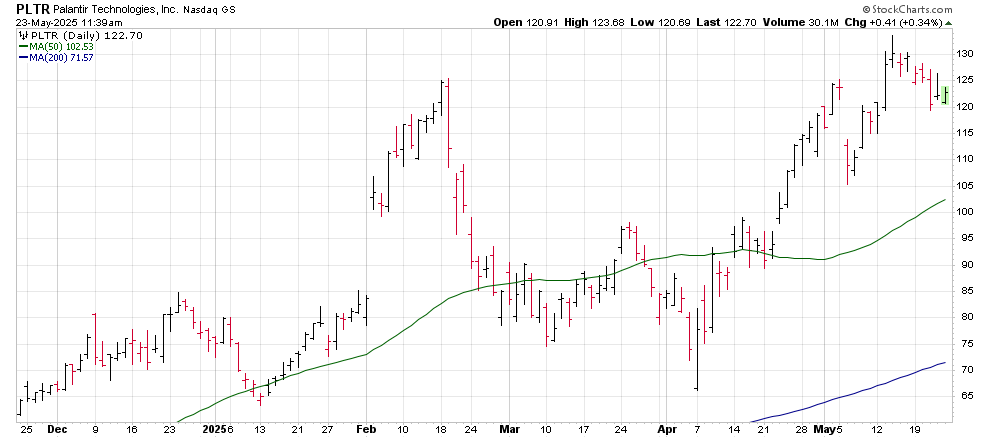
Palantir (PLTR)
Palantir shares are not “Overvalued”, the stock is underappreciated.
Palantir has turned into one of Wall Street’s most controversial and most-watched AI plays. Despite its high valuation, the stock continues to ride bullish momentum as it expands its government and commercial contracts. With a 62% YTD gain, it’s climbing the classic “Wall of Worry.”
Outlook: Bullish
Target Price: $175
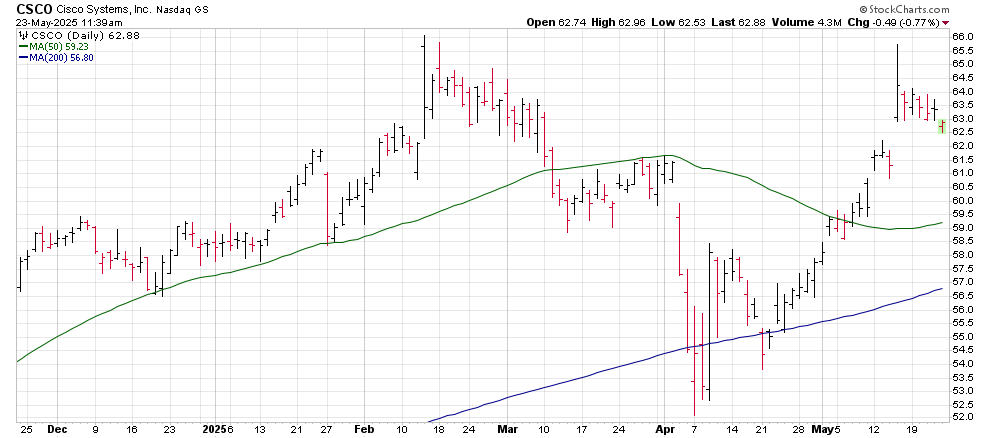
Cisco (CSCO)
Cisco may seem boring, but the company is once again reinventing itself. Cisco is still a backbone provider for the internet and enterprise networks and the company’s shift to AI data center business is a strong pivot.
Its technical setup is one of slow accumulation, exactly the kind of stock that often surprises to the upside.
Outlook: Bullish
Target Price: $75
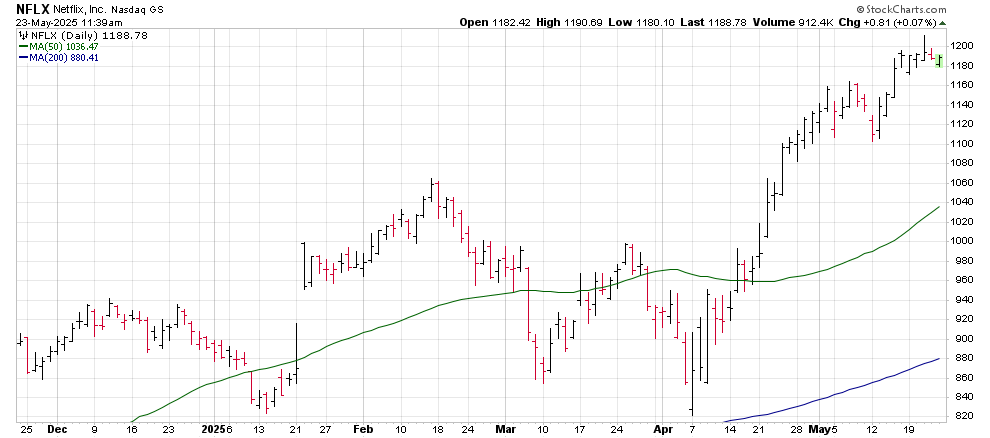
Netflix (NFLX)
With a 33% gain so far this year, Netflix has quietly become one of the best-performing big-cap tech names.
The company’s push into live sports and ad-supported tiers has reinvigorated growth. The chart shows strength and resilience—even on red market days.
Outlook: Bullish
Target Price: $1,400
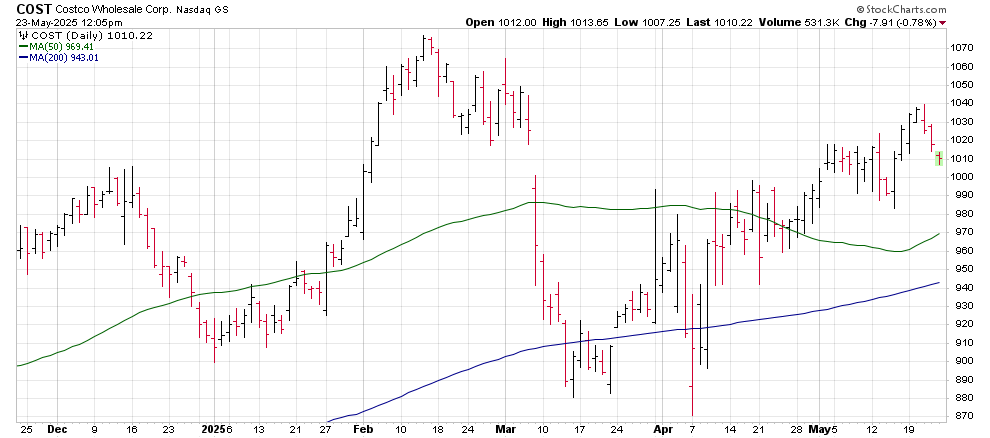
Costco (COST)
Costco isn’t just a safe-haven consumer stock. It’s also quietly been in one of the most consistent uptrends on Wall Street. The stock was one of the big winners during the last battle with inflation and investors should expect the same this time around.
Technical buyers have supported the stock every time it nears the 50-day. As volatility rises, this is the kind of name institutions cling to.
Outlook: Bullish
Target Price: $1,200
The Bottom Line
With market’s drifting lower or stuck in a trendless churn, investors need a plan. Technical analysis gives you that plan. It cuts through the noise and reveals where real strength lies.
Right now, that strength exists in a small fraction of the market—just 37% of the S&P 500 and Nasdaq 100. That’s where you need to be looking.
Focus on the stocks that are above rising 50- and 200-day moving averages. They are the ones already leading. And when this bear market ends, they’re the ones most likely to keep climbing.

