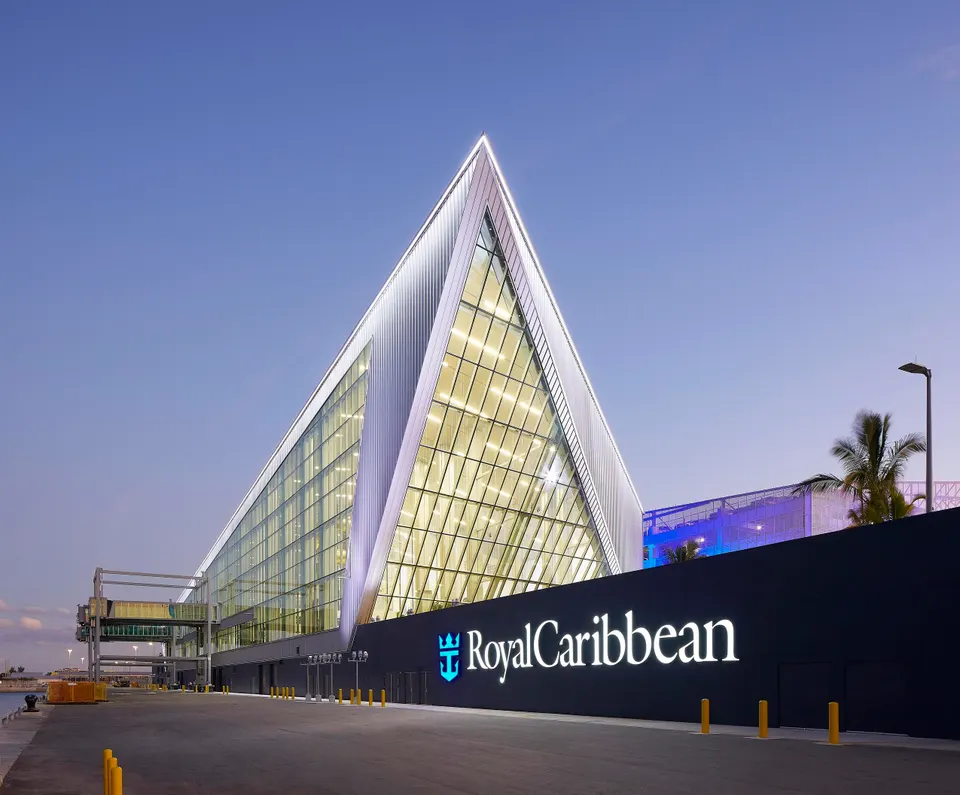
Exterior facade. Royal Caribbean Miami Cruise Terminal, Miami, United States. Architect: Broadway Malyan Limited, 2019. (Photo by: View Pictures/Hufton+Crow/Universal Images Group via Getty Images)
View Pictures/Universal Images Group via Getty Images
Royal Caribbean (RCL) shares have decreased by 16.1% over the course of 21 trading days. This recent downturn is indicative of renewed apprehensions regarding Royal Caribbean’s revenue shortfall and a cautious sales forecast amid a broader weakness within the sector. However, steep declines like this often prompt a more challenging inquiry: is this weakness temporary, or does it indicate more serious underlying issues?
Before evaluating its downturn resilience, let us examine Royal Caribbean’s current position.
- Size: Royal Caribbean is a company valued at $72 Billion with revenue of $17 Billion, presently trading at $263.43.
- Fundamentals: Over the last 12 months, revenue growth has been 8.6% with an operating margin of 26.4%.
- Liquidity: The company has a Debt to Equity ratio of 0.29 and a Cash to Assets ratio of 0.01.
- Valuation: Currently, Royal Caribbean stock has a P/E ratio of 17.6 and a P/EBIT ratio of 14.1.
- Historically, the stock has yielded a (median) return of 26.4% within a year following significant declines since 2010. Refer to RCL Dip Buy Analysis.
These metrics suggest a Strong operational performance, paired with a Moderate valuation, making the stock Attractive.
This leads us to the critical aspect for investors concerned about this decline: how resilient is RCL stock if the markets decline? While we prefer to purchase during dips when the fundamentals prove solid (see Buy or Sell RCL Stock) – we remain cautious of potential falling knives.
This is where our downturn resilience framework is relevant. Assume RCL stock drops another 20-30% to $184 – can investors securely hold their positions? It turns out that the stock has performed worse than the S&P 500 index during various economic downturns, based on (a) the magnitude of the stock’s decline and (b) the speed of its recovery. Equities are not the only asset class we consider. A portfolio containing 10% commodities, 10% gold, and 2% crypto in addition to equities and bonds – has a higher likelihood of yielding better returns and offering superior protection. We have analyzed the data.
Here are the details, but before that, for a brief overview: RCL is a global cruise operator providing a variety of travel experiences through multiple premium brands, headquartered in Miami, and established in 1968.
2022 Inflation Shock
- RCL shares decreased by 67.7% from a high of $96.98 on 2 June 2021 to $31.28 on 14 July 2022, compared to a peak-to-trough decline of 25.4% for the S&P 500.
- Nonetheless, the stock entirely rebounded to its pre-Crisis peak by 21 June 2023.
- Since then, the stock rose to a peak of $365.84 on 28 August 2025, and is currently trading at $263.43.
2022 Inflation Shock
Trefis
2020 Covid Pandemic
- RCL shares fell by 83.5% from a peak of $135.05 on 17 January 2020 to $22.33 on 18 March 2020, in contrast to a peak-to-trough decline of 33.9% for the S&P 500.
- However, the stock completely recovered to its pre-Crisis high by 20 March 2024.
2018 Correction
- RCL shares decreased by 33.7% from a peak of $134.98 on 26 January 2018 to $89.48 on 24 December 2018, compared to a peak-to-trough decline of 19.8% for the S&P 500.
- Nonetheless, the stock entirely rebounded to its pre-Crisis high by 17 January 2020.
2008 Global Financial Crisis
- RCL shares decreased by 88.0% from a peak of $45.84 on 2 February 2007 to $5.50 on 2 March 2009, in contrast to a peak-to-trough decline of 56.8% for the S&P 500.
- However, the stock completely rebounded to its pre-Crisis high by 21 December 2010.
It is wise to consider how low RCL may fall during a downturn. Additionally, you should compare how the stock has performed against the Trefis High Quality (HQ) Portfolio, which includes a collection of 30 stocks known for consistently outperforming its benchmark, which encompasses all three indices: S&P 500, S&P mid-cap, and Russell 2000. What accounts for this? As a collective, HQ Portfolio stocks have delivered superior returns with reduced risk in comparison to the benchmark index; presenting a smoother experience, as demonstrated in HQ Portfolio performance metrics.


