- USD/CAD trades lower on Monday as rising Oil prices support the Canadian currency.
- US Oil climbs back above $90 after fresh strikes hit Saudi Oil facilities.
- Fed rate hike expectations and geopolitical tensions support the US Dollar, limiting the pair’s decline.
USD/CAD trades around 1.3810 on Monday at the time of writing, down 0.15% on the day. The pair comes under some pressure as the sharp rise in Oil prices supports the Canadian Dollar (CAD), although underlying strength in the US Dollar (USD) limits the downside.
West Texas Intermediate (WTI) US Oil accelerates and climbs back above the $90 level, gaining more than 1% on Monday to trade around $90.50 at the time of writing. The move comes after the Financial Times reported fresh strikes on Saudi Aramco Oil facilities in Jizan, Saudi Arabia.
Higher Oil prices tend to support the Loonie as Canada is a major Oil producer and exporter. An increase in Crude prices generally improves the country’s export revenue outlook and can strengthen demand for the Canadian currency. This factor helps the CAD withstand the impact of Friday’s weak Canadian employment report.
On the US side, the US Dollar retains several sources of support. Friday’s strong Nonfarm Payrolls (NFP) report reinforces expectations that the Federal Reserve (Fed) could raise interest rates at its September meeting, as higher energy prices fuel concerns about inflationary pressures.
Geopolitical tensions also support the Greenback due to its safe-haven status. Escalating tensions in the Middle East, now directly affecting Saudi Oil infrastructure, keep a geopolitical risk premium in markets and could limit USD/CAD’s ability to extend its decline.
Investors will now monitor developments in the conflict and Oil prices while awaiting the next batch of United States (US) inflation data. The Producer Price Index (PPI) and Consumer Price Index (CPI), due on Thursday and Friday, respectively, could provide fresh clues about the Fed’s monetary policy path and influence the direction of the US Dollar.
USD/CAD technical analysis
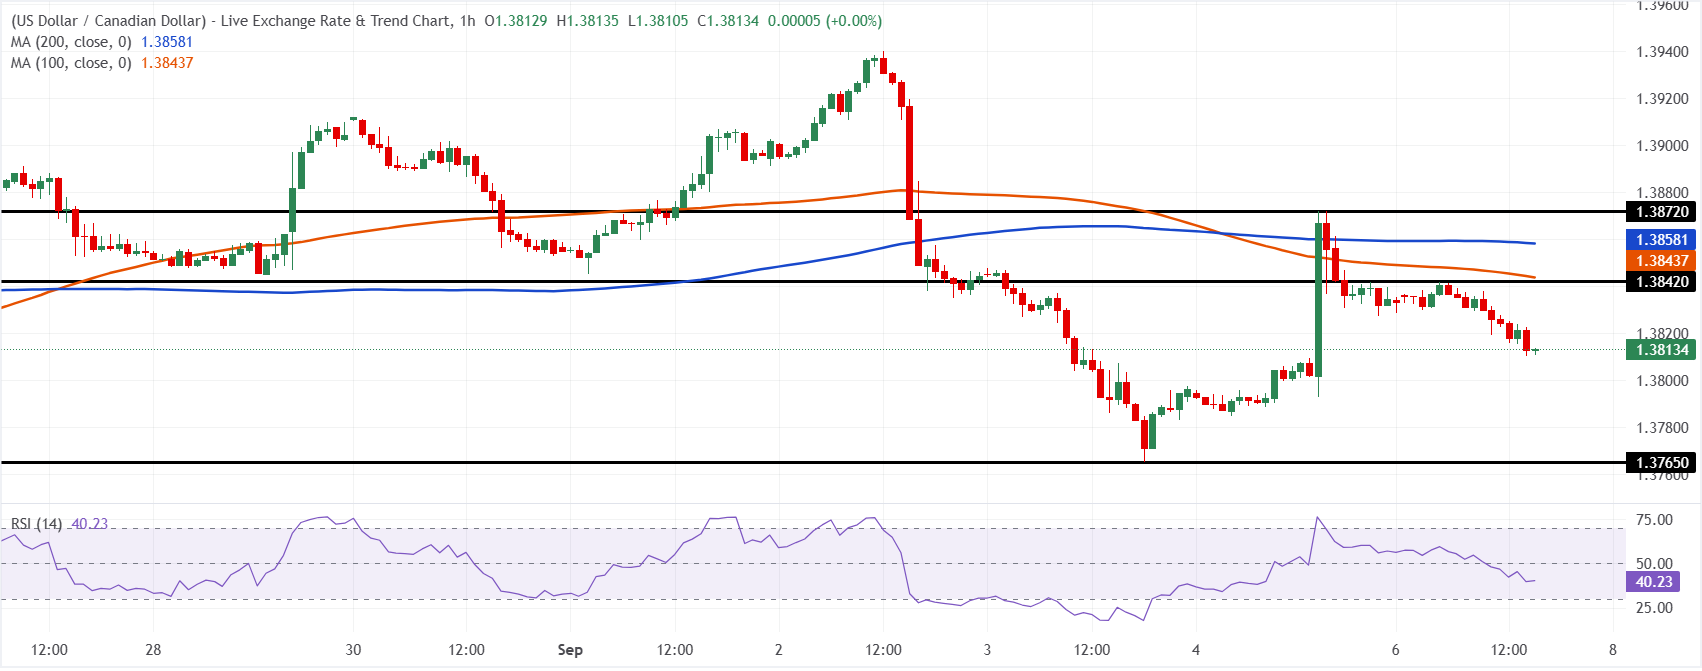
In the one-hour chart, USD/CAD trades at 1.3813, keeping a modest bearish bias as it holds below the 100-period and 200-period simple moving averages (SMAs) at roughly 1.3844 and 1.3858. The pair has slipped back under the nearby horizontal cap at 1.3842, suggesting rallies are being sold, while the Relative Strength Index (RSI) near 40 hints at soft but not yet oversold downside momentum.
On the topside, immediate resistance is aligned at 1.3842, with the 100-period SMA clustered just above at 1.3844, followed by the 200-period SMA at 1.3858 and the next horizontal barrier near 1.3872. On the downside, initial support emerges at the horizontal floor around 1.3765, and a break below this level would reinforce the prevailing bearish tone and open the door to further weakness.
(The technical analysis of this story was written with the help of an AI tool. Know more.)
Disclaimer: For information purposes only. Past performance is not indicative of future results.