
- Dollar General reported second quarter sales of US$11,290.38 million and net income of US$550.32 million, raised full year net sales growth guidance to 4.0% to 4.3%, and lifted expected diluted EPS to US$7.80 to US$8.00.
- Alongside the stronger earnings outlook, Dollar General affirmed its US$0.59 quarterly dividend and outlined thousands of remodels and new stores, signaling continued investment in its store base and operations.
- With raised earnings guidance now on the table, this piece will look at how the upgraded outlook reshapes Dollar General’s investment narrative.
Seize this moment around Dollar General’s upgraded outlook to evaluate other retailers with resilient balance sheets and earnings power through our hand picked 49 high quality undervalued stocks.
Dollar General Investment Narrative Recap
For anyone holding Dollar General, the core belief is still that a dense, low cost store network and tight cost control can turn steady traffic into dependable cash generation. The raised full year sales and EPS guidance keeps that thesis intact in the near term. The main short term swing factor remains execution on remodels and new stores, because 4,730 real estate projects in 2026 leave little room for missteps. The biggest near term risk is execution fatigue, where labor costs, shrink or store saturation could erode the margin progress seen in the latest results.
The announcement that Dollar General is partnering with RELEX Solutions to run forecasting, replenishment and allocation on a single AI driven platform sits right next to that store expansion catalyst. Better inventory planning can support thousands of remodels and new openings by reducing stockouts and excess stock. It also addresses some operational risks that often come with rapid growth, such as higher shrink, inefficient trucking and inconsistent on shelf availability. If this system is rolled out smoothly, it could support the higher sales guidance, yet any implementation issues would quickly show up in working capital and service levels.
Yet there is one operational weak spot in this story that deserves closer attention before you get too comfortable with those upgrades…
Read the full Dollar General narrative to see the case behind these numbers.
Dollar General’s narrative projects US$48.8b revenue and US$1.9b earnings by 2029. This implies 4.3% yearly revenue growth and an earnings increase of about US$300m from US$1.6b today.
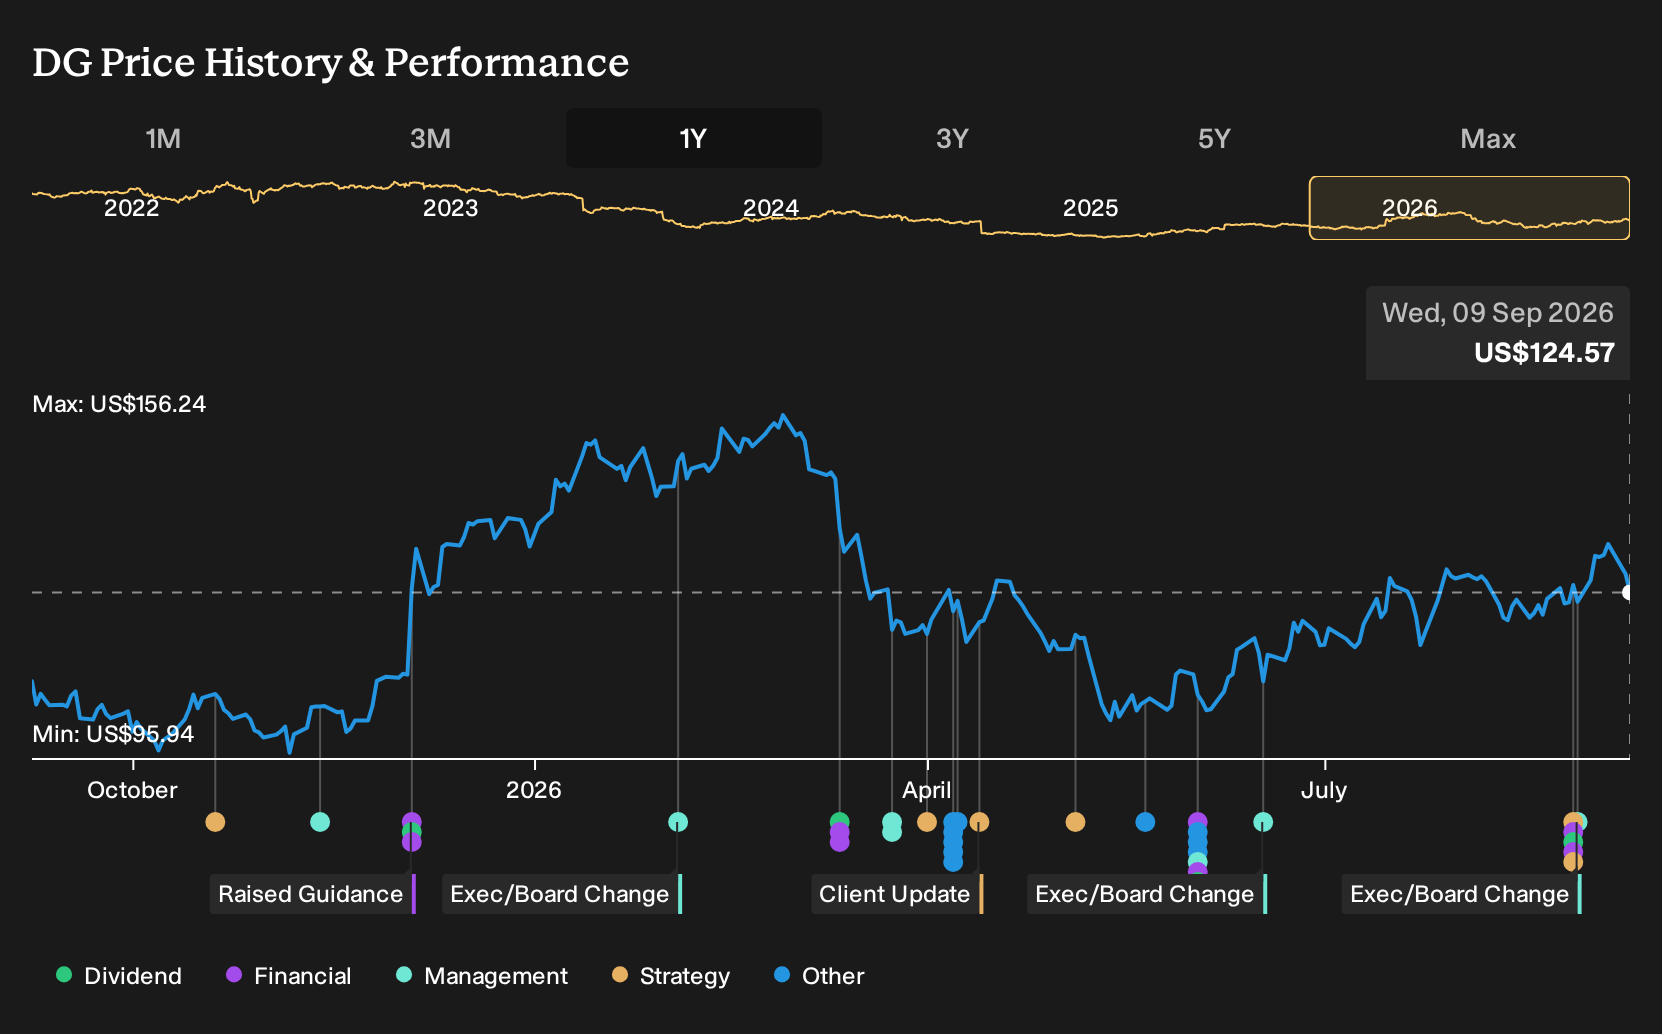
Dollar General’s forecasts flag a $131.07 fair value against the $124.57 share price, indicating a 5% upside to its current price.
Exploring Other Perspectives
One alternate view focuses on store closures and softer traffic rather than Dollar General’s remodel push and guidance hike. The most pessimistic analysts had modeled revenue climbing closer to 3.6% a year and earnings around US$1.8b by 2029, which supports a lower fair value. That gap shows how widely opinions can differ, so it can be useful to compare several narratives before deciding what this new guidance and leadership change might mean for you.
To see how your view compares with other investors tracking Dollar General, review the 6 other fair value estimates for Dollar General.
The Verdict Is Yours
Don’t just follow the ticker; dig into the data and build a conviction that’s truly your own.
- A great starting point for your Dollar General research is our analysis highlighting 5 key rewards that could impact your investment decision.
- See our latest analysis for Dollar General. The report includes a comprehensive fundamental analysis summarized in a single visual, the Snowflake, making it easy to evaluate Dollar General’s overall financial health at a glance.
Looking For More Ideas Beyond Dollar General?
If this Dollar General update has sharpened your thinking and you want to stress test your approach against a wider opportunity set, the Simply Wall St Screener can help you quickly filter the market by balance sheet strength, valuation, and income potential so you can focus on companies that actually fit your plan.
This article by Simply Wall St is general in nature. We provide commentary based on historical data
and analyst forecasts only using an unbiased methodology and our articles are not intended to be financial advice. It does not constitute a recommendation to buy or sell any stock, and does not take account of your objectives, or your
financial situation. We aim to bring you long-term focused analysis driven by fundamental data.
Note that our analysis may not factor in the latest price-sensitive company announcements or qualitative material.
Simply Wall St has no position in any stocks mentioned.
New: Manage All Your Stock Portfolios in One Place
We’ve created the ultimate portfolio companion for stock investors, and it’s free.
• Connect an unlimited number of Portfolios and see your total in one currency
• Be alerted to new Warning Signs or Risks via email or mobile
• Track the Fair Value of your stocks
Have feedback on this article? Concerned about the content? Get in touch with us directly. Alternatively, email [email protected]