
EUR/USD Current price: 1.1639
- The Federal Reserve and the European Central Bank take centre stage this week.
- Easing trade tensions and political turmoil in France shape the market’s mood.
- EUR/USD pressures the upper end of its latest range, awaits a fresh catalyst.
The EUR/USD pair trades marginally higher early in the American session on Monday, reversing an early slide towards 1.1617. The US Dollar (USD) rose at the weekly opening amid fresh hopes for easing trade tensions between the United States (US) and China. US Treasury Secretary Scott Bessent said China eliminated the latest US President Donald Trump’s threat of 100% tariffs after talks between top representatives on the sidelines of the ASEAN Summit in Kuala Lumpur, and ahead of the Trump-Xi Jinping meeting later this week. Bessent said they have a “successful framework” for them to discuss.
Other than that, market participants are keeping an eye on France. The government decided to delay a critical tax vote that could determine the fate of Prime Minister Sébastien Lecornu. The Socialist party has threatened to file a censure motion on the minority government should a budget bill fail.
On the data front, there is nothing relevant scheduled, although the Federal Reserve (Fed) and the European Central Bank (ECB) will announce their monetary policy decisions this week. The Fed is widely anticipated to trim interest rates, while the ECB is expected to hold its fire; both decisions are long ago priced in. The focus will be on what policymakers have to say about the economic performance, and hence, what would be next for monetary policy.
EUR/USD short-term technical outlook:
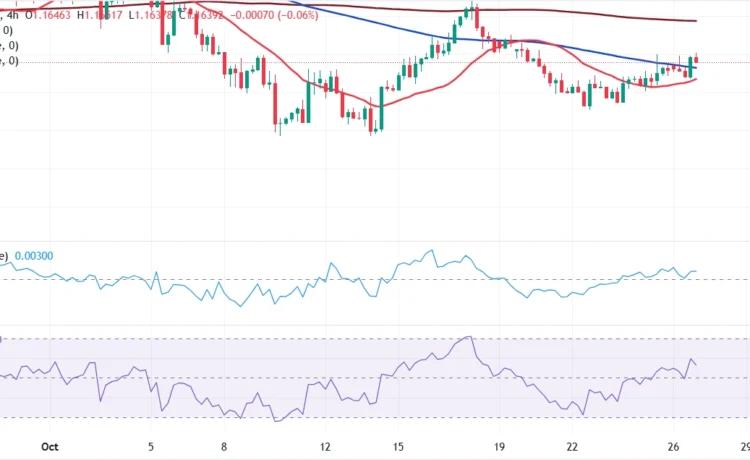
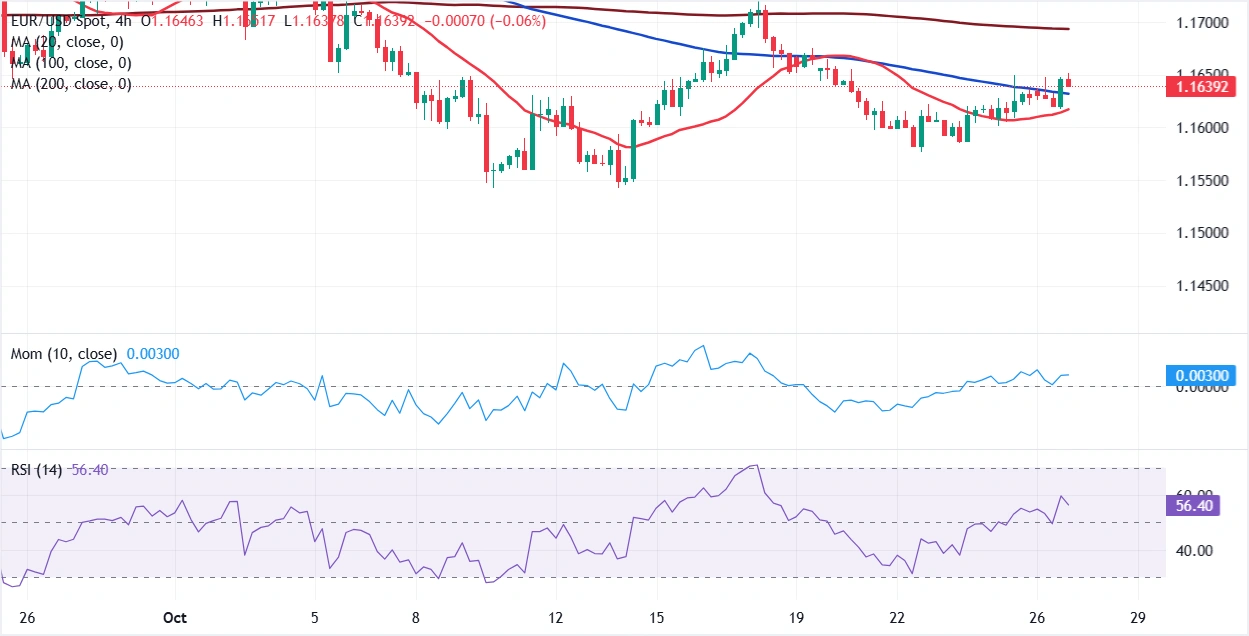
In the 4-hour chart, EUR/USD is currently trading at 1.1639, little changed on a daily basis and roughly 8 pips above the day’s opening price. The pair holds above the 20 and 100 Simple Moving Averages (SMAs), improving the near-term tone even as the broader setup remains biased lower. The 20 SMA advances below the longer ones, providing dynamic support at 1.1617. Furthermore, the 100 SMA is mildly bearish, falling above the shorter one at 1.1632, while the 200 SMA continues to edge south at 1.1693 and caps the topside. Immediate supports align at 1.1632-1.1617, while initial resistance is the descending 200 SMA at 1.1693.
At the same time, the Momentum indicator has turned positive but remains below recent highs, flagging moderate buying interest rather than an impulsive leg higher. The Relative Strength Index (RSI) indicator holds above its neutral 50 line at 56.4 but has eased from earlier peaks, suggesting waning upside strength and reflecting the ongoing consolidation. As long as the pair stays above the 100/20-SMA belt, risks are tilted modestly higher toward the 200 SMA; a clear break of 1.1693 is needed to unlock additional gains. Conversely, a sustained move back below 1.1617 would revive selling pressure in line with the declining longer averages.
In the daily chart, EUR/USD has a limited upward scope. Moving averages point to a near-term bearish bias as a bearish 20-day SMA at 1.1650 slides below the longer ones, suggesting sellers hold the grip in the near term. Meanwhile, the 100-day SMA continues to advance and stands at 1.1662, reinforcing the resistance area. Further below, the 200-day SMA keeps grinding higher at 1.1291, acting as a major dynamic support.
The Momentum indicator has turned positive, aiming north just above its midline, yet the RSI indicator at 47.6 signals that bullish conviction is still lacking. As a result, rebounds are likely to meet supply on approach to the 20- and 100-day SMAs, and only a decisive daily close above the 100-day average would temper the downside pressure and open the door to additional gains. Until then, the risk leans lower while price holds beneath the 1.1650-1.1662 resistance band, with the rising 200-day SMA at 1.1291 remaining a distant but firm support level.
(This content was partially created with the help of an AI tool)


