

Moreover, political uncertainty adds another layer of support for gold. The Trump administration’s return could unsettle markets and slow economic growth. A liquidity squeeze could trigger a correction, especially with US stocks trading at high valuations. A weakening Dollar and reduced Treasury inflows would further enhance gold’s attractiveness. Investors may turn to gold as a safe-haven asset if economic instability persists.
Key economic indicators will shape the market this week. US GDP data, consumer confidence, and the core PCE price index will directly impact the US Dollar and gold prices. Traders and investors should closely monitor these reports for potential market movements.
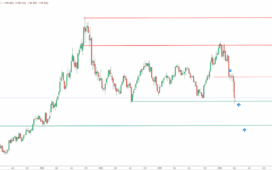
Gold (XAU) Technical Analysis
Gold Daily Chart – Thin Range
The daily chart for gold shows that the price has reached the orange zone of $2,900–$3,000 and is consolidating to stabilize at higher levels. Despite the strong resistance zone, the price has not dropped quickly. Instead, it is stabilizing for further gains. However, the overbought conditions observed using the RSI indicate that the price may correct lower before a strong move higher. If the price fails to break the $2,950–$3,000 zone and starts to correct lower, the $2,800 level will be a strong support.


