

XAU/USD Current price: $2,853.00
- The Bank of England’s dovish cut helped the US Dollar to retain its recent strength.
- The market mood improved, yet investors are far from optimistic.
- XAU/USD is in a corrective decline that could continue in the near term.
The US Dollar (USD) found some near-term demand on Thursday, resulting in XAU/USD retreating from record highs. The pair trades around $2,850 in the American session after hitting $2,882.35 on Wednesday. An improved market mood adds pressure on the safe-haven metal, albeit speculative interest is far from optimistic.
Trade-war tensions have been put temporarily aside but remain firm in the background as attention has shifted to first-tier events. On the one hand, the United States (US) kept publishing employment-related data ahead of the January Nonfarm Payrolls report scheduled for Friday. The country is expected to have added 170K new jobs in the month, while the Unemployment Rate is expected to hold steady at 4.1%. Employment-related data released ahead of the announcement has been tepid yet far from worrisome.
Additionally, the Bank of England (BoE) announced its monetary policy decision. The Monetary Policy Committee (MPC) trimmed the benchmark interest rates by 25 basis points (bps) to 4.50% as expected, although the dovish surprise came from policymakers, as all nine MPC members voted for a cut, with two of them favoring a 50 bps trim. Additionally, officials upwardly review their near-term inflation perspective while downgrading growth expectations for this year. The dovish tone of the BoE helped the USD maintain its near-term strength.
Looking ahead, however, demand for the bright metal is set to prevail amid continued uncertainty regarding the US tariffs’ plan.
XAU/USD short-term technical outlook
From a technical point of view, the daily chart for XAU/USD shows that the ongoing slide could be seen as corrective. A lower low and a lower high, however, suggest a bearish extension is likely. The same chart shows that technical indicators are retreating from their recent peaks in overbought territory but with limited downward strength and still at extreme levels. At the same time, the bright metal develops above all bullish moving averages, with the 20 Simple Moving Average (SMA) currently at around $2,755.35.
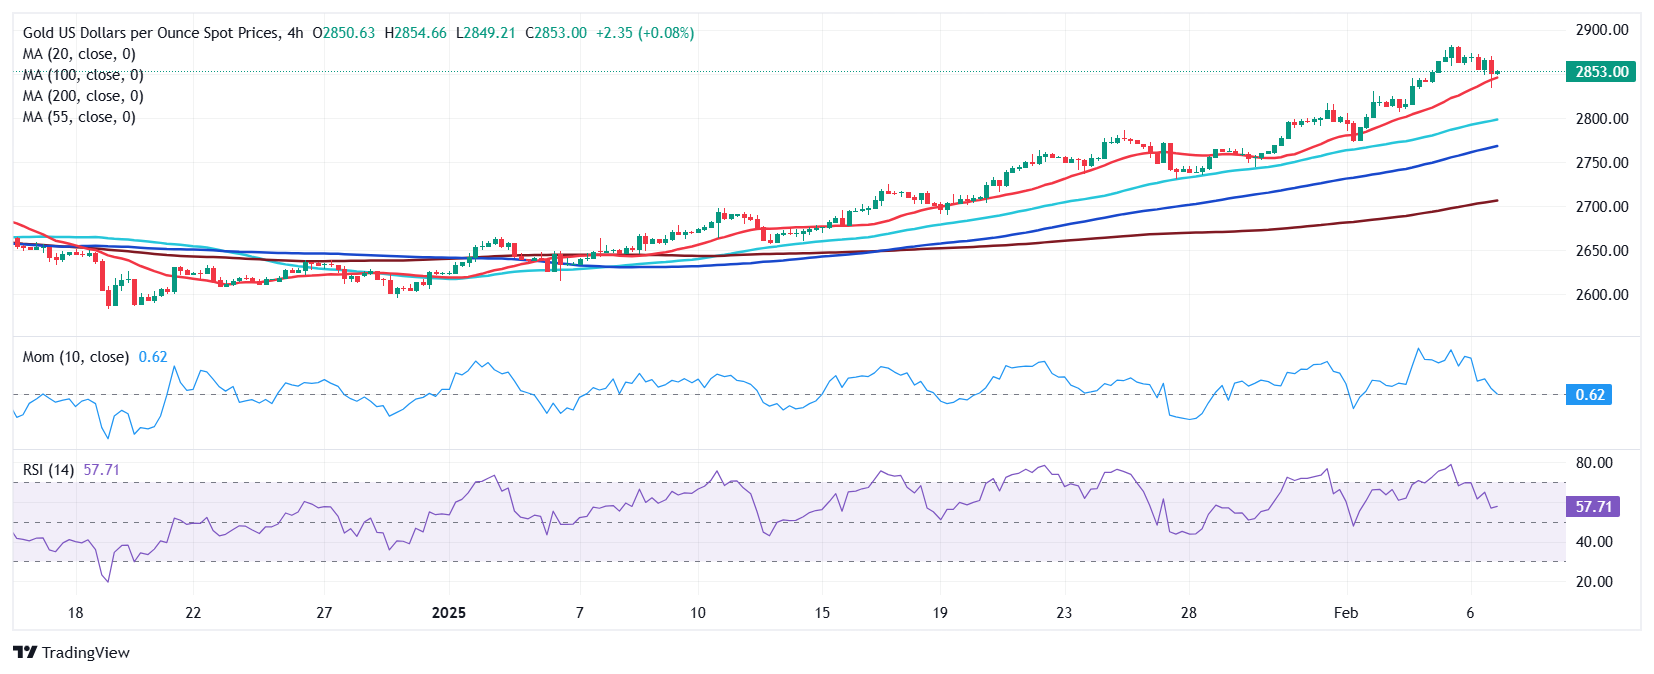
The 4-hour chart anticipates another leg lower, particularly if XAU/USD slides below the intraday low at $2,833.96, although still suggesting declines would remain corrective. The pair is battling to remain above a bullish 20 SMA while the 100 and 200 SMAs head north far below the shorter one. Technical indicators, in the meantime, have corrected extreme overbought conditions and are currently approaching their midlines with firmly bearish slopes.
Support levels: 2,834.00 2,817.10 2,803.50
Resistance levels: 2,862.70 2,883.00 2,900.00


