

- The US Dollar appreciates against all major peers on Thursday.
- Traders see the Fed confirming market projections on cutting cycle for 2025.
- The US Dollar Index is still stuck between 103.00 and 104.00 for now.
The US Dollar Index (DXY), which tracks the performance of the US Dollar (USD) against six major currencies, rallies towards 104.00 on Thursday after the weekly jobcless claims data. Borrowing costs were kept unchanged overnight by the Federal Reserve (Fed), and projected two interest rate cuts for 2025. During Wednesday’s Fed meeting, Chairman Jerome Powell said that any tariff-driven bump in inflation will be “transitory.” However, he added later that it will be very challenging to say with confidence how much inflation stems from tariffs versus other factors. He also said recession odds have moved up, though are not high, Bloomberg reports.
On the economic data front, the US jobless claims and the Philadelphia manufacturing data will be key. After Powell highlighted that the US economy might start to ease, traders will look for proof of that. Any data that comes in far below the benchmark could trigger some US Dollar weakness.
Daily digest market movers: Not impressed
- At 12:30 GMT, the most important data for this Thursday was released:
- US Initial Jobless Claims ticekd up to 223,000, coming from 221,000. The US Continuing Jobless Claims came in at 1,892 million against 1,859million last week.
- The Philadelphia Fed Manufacturing Survey for March fell to 12.5, better than the expected 8.5 and from the previous 18.1.
- At 14:00 GMT, US Existing Home Sales month-on-month for February will be released. Expectations are for a contraction to 3.95 million compared to 4.08 million the previous month.
- Equities are struggling with European indices facing big profit-taking. The German Dax is down over 1%, while US futures are starting to roll over.
- According to the CME Fedwatch Tool, the probability of interest rates remaining at the current range of 4.25%-4.50% in May’s meeting is at 80.5%. For June, the odds for borrowing costs being lower stand at 71.1%.
- The US 10-year yield trades around 4.18%, heading back to its five-month low of 4.10% printed on March 4.
US Dollar Index Technical Analysis: Hard to read
The US Dollar Index (DXY) is trying to break out of a short-term technical descending triangle pattern. The tilted side of a triangle should act as strong resistance while the flat base of the triangle at 103.18 should act as strong support. Normally, the textbook logic is that sellers will build up positions alongside the tilted descending trend line in order to break through that flat base, which will result in more downturn.
The fact that currently the DXY is trying to break out of that pattern could be a sign for a turnaround, though heavy resistance is awaiting just around the corner at 104.00.
If bulls can avoid a technical rejection at 104.00, a large sprint higher towards the 105.00 round level could happen, with the 200-day Simple Moving Average (SMA) converging at that point and reinforcing this area as a strong resistance. Once broken through that zone, a string of pivotal levels, such as 105.53 and 105.89, could limit the upward momentum.
On the downside, the 103.00 round level could be considered a bearish target in case US yields roll off on deteriorating US data, with even 101.90 on the table if markets further capitulate on their long-term US Dollar holdings.
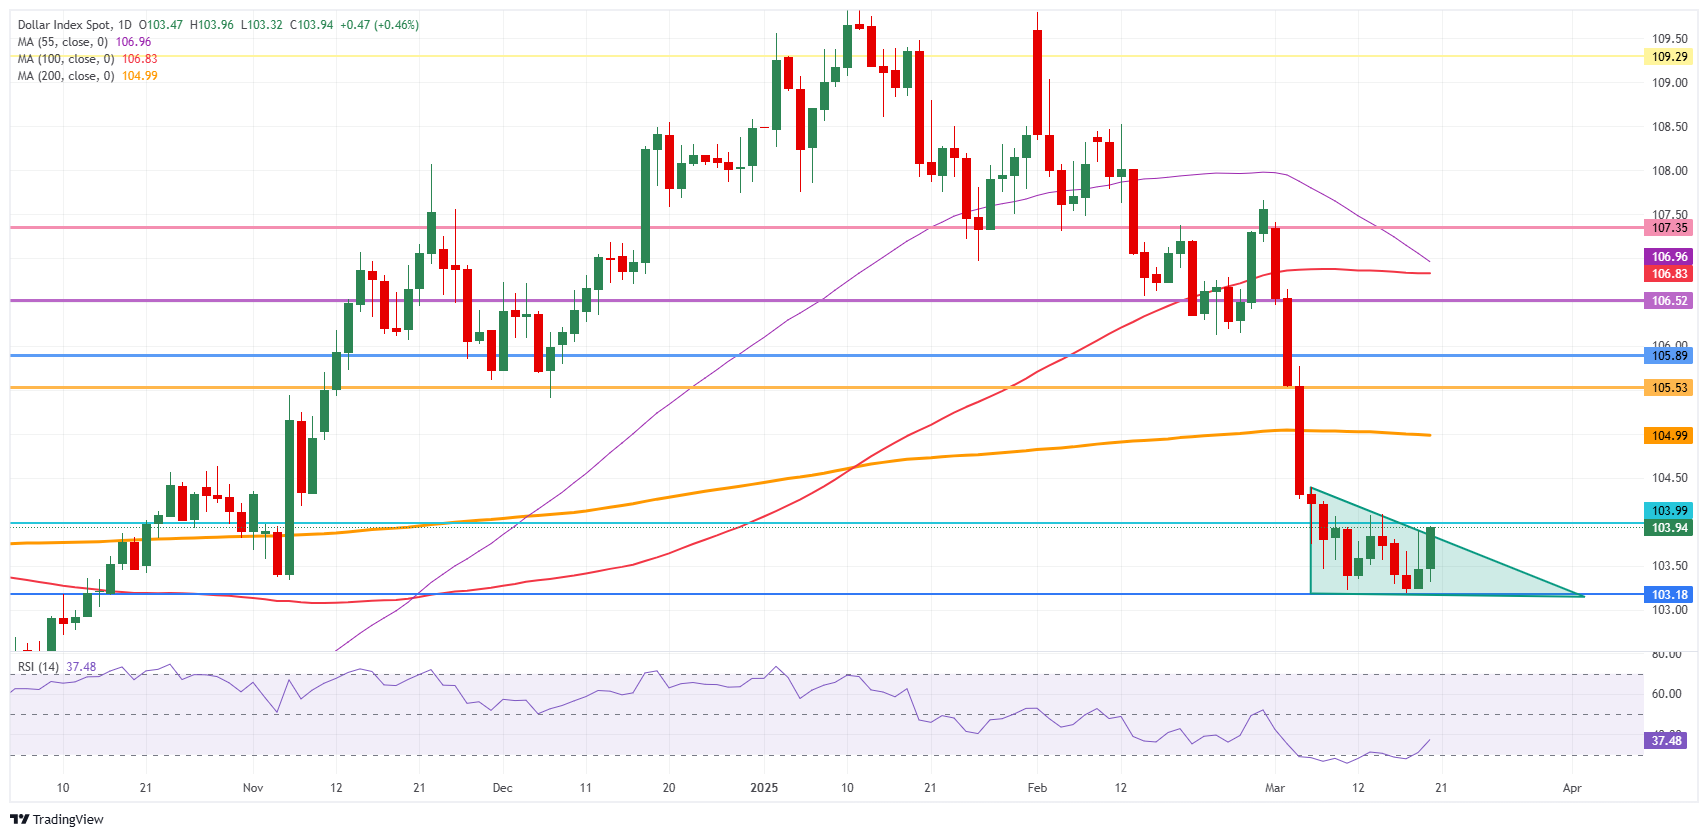
US Dollar Index: Daily Chart


