

- The US Dollar trades positive traders digest the recent negative Dallas Fed Manufacturing Survey.
- The Trump administration puts negotiation attempt with China aside to focus on other countries first.
- The US Dollar Index is still capped below the 100.00 round level, trading near 99.40 on Tuesday.
The US Dollar Index (DXY), which tracks the performance of the US Dollar (USD) against six major currencies, is seeing a small bounce and trades at 99.35 at the time of writing on Tuesday. The dust is still settling after the Dallas Federal Reserve (Fed) released the April Manufacturing Sentiment Index on Monday. Besides the fact that the number contracted to -35.8, a number not seen since the COVID pandemic, the actual report mentioned participants’ comments.
Participants expressed their current sentiment with words like “chaos” and “insanity”, in order to describe the turmoil spurred by US President Donald Trump’s tariffs. That gives a flurry of how things are unwinding in the US under the current tariff schemes. US yields dip as well as traders bet on increased chances for the Fed to cut interest rates rather sooner than later, should the upcoming US economic data this week, with the preliminary Q1 Gross Domestic Product (GDP) and the Nonfarm Payrolls (NFP) for April, be as gruesome as the Dallas Fed Manufacturing print.
On the economic calendar front, there is some lighter data ahead on Tuesday, with the central theme on the JOLTS Job Openings report for March. Although this is backward-looking, before US tariffs were implemented, it could already give a sentiment if US companies were preparing for an impact and reduced their job hiring activity. Besides that, the preliminary US Goods Trade Balance for March is also expected.
Daily digest market movers: Volatility set to peak again
- At 12:30 GMT, the preliminary US Goods Trade Balance for March is due. No forecast available with the previous deficit at $147 billion.
- Preliminary Wholesale Inventories for March are also due at the same time, expected to tick up 0.7% from the 0.3% increase in February.
- At 13:00 GMT, the February House Price Index is due. It is expected to tick up 0.3% from 0.2% in February.
- At 14:00 GMT, the JOLTS Job Openings report for March is expected to contract further to 7.5 million, coming from 7.568 million previously. The Consumer Confidence for April is also due, though no forecast is available.
- Equities are steady with very small gains to report overall, on average below 0.5% for both European indices and the US Futures markets.
- The CME FedWatch tool shows the chance of an interest rate cut by the Federal Reserve in the May’s meeting stands at 8.9% against a 91.1% probability of no change. The June meeting sees a 62.6% chance of a rate cut.
- The US 10-year yields trade around 4.23%, ticking a bit lower with traders slowly but surely buying back into US bonds.
US Dollar Index Technical Analysis: Not moving but something is brewing
The US Dollar Index (DXY) is not going anywhere as traders keep their powder dry for the US key economic data later this week. Meanwhile some geopolitical headlines on easing tariffs are off-setted by headlines from China or other countries in response to the Trump administration. When looking at US data, the Dallas Fed Manufacturing survey could be the first real sign that the US economic performance will start to deteriorate, calling for quick interest rate cuts from the Fed, and a weaker US Dollar before US economic numbers recover again.
On the upside, the DXY’s first resistance comes in at 100.22, which supported the DXY back in September 2024, with a break back above the 100.00 round level as a bullish signal. A firm recovery would be a return to 101.90, which acted as a pivotal level throughout December 2023 and again as a base for the inverted head-and-shoulders formation during the summer of 2024.
On the other hand, the 97.73 support could quickly be tested on any substantial bearish headline. Further below, a relatively thin technical support comes in at 96.94 before looking at the lower levels of this new price range. These would be at 95.25 and 94.56, meaning fresh lows not seen since 2022.
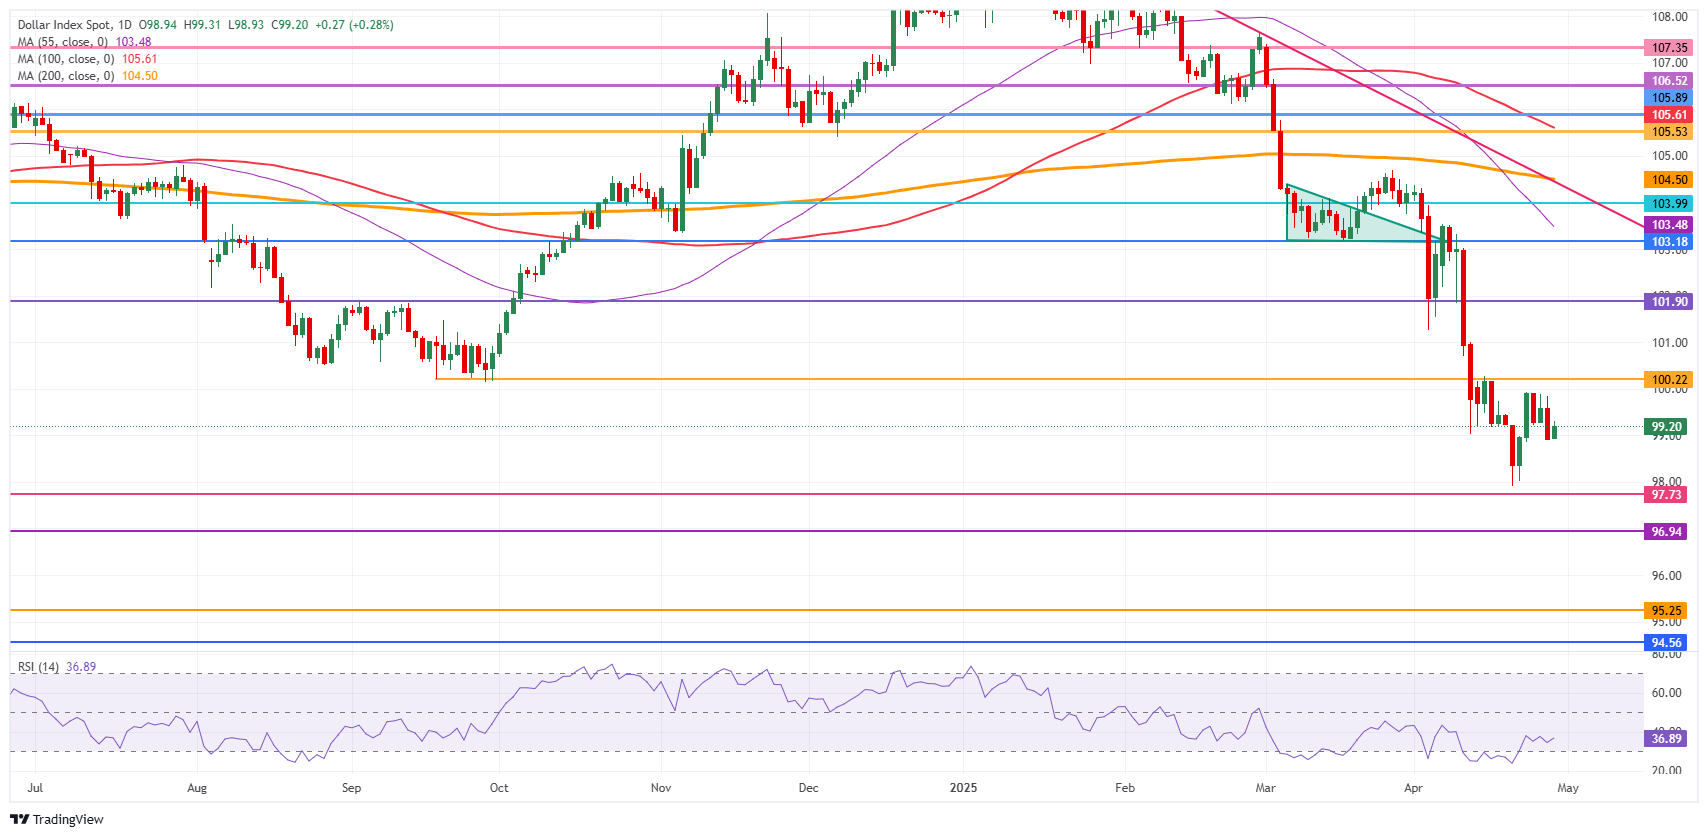
US Dollar Index: Daily Chart
US Dollar FAQs
The US Dollar (USD) is the official currency of the United States of America, and the ‘de facto’ currency of a significant number of other countries where it is found in circulation alongside local notes. It is the most heavily traded currency in the world, accounting for over 88% of all global foreign exchange turnover, or an average of $6.6 trillion in transactions per day, according to data from 2022.
Following the second world war, the USD took over from the British Pound as the world’s reserve currency. For most of its history, the US Dollar was backed by Gold, until the Bretton Woods Agreement in 1971 when the Gold Standard went away.
The most important single factor impacting on the value of the US Dollar is monetary policy, which is shaped by the Federal Reserve (Fed). The Fed has two mandates: to achieve price stability (control inflation) and foster full employment. Its primary tool to achieve these two goals is by adjusting interest rates.
When prices are rising too quickly and inflation is above the Fed’s 2% target, the Fed will raise rates, which helps the USD value. When inflation falls below 2% or the Unemployment Rate is too high, the Fed may lower interest rates, which weighs on the Greenback.
In extreme situations, the Federal Reserve can also print more Dollars and enact quantitative easing (QE). QE is the process by which the Fed substantially increases the flow of credit in a stuck financial system.
It is a non-standard policy measure used when credit has dried up because banks will not lend to each other (out of the fear of counterparty default). It is a last resort when simply lowering interest rates is unlikely to achieve the necessary result. It was the Fed’s weapon of choice to combat the credit crunch that occurred during the Great Financial Crisis in 2008. It involves the Fed printing more Dollars and using them to buy US government bonds predominantly from financial institutions. QE usually leads to a weaker US Dollar.
Quantitative tightening (QT) is the reverse process whereby the Federal Reserve stops buying bonds from financial institutions and does not reinvest the principal from the bonds it holds maturing in new purchases. It is usually positive for the US Dollar.


