

- Gold price sits at two-week lows below $2,900, awaiting US PCE inflation data.
- US Dollar stands tall amid Trump’s tariff threats while US Treasury yields tank on dovish Fed bets.
- Gold price finds acceptance below the 21-day SMA at $2,890, but the daily RSI stays bullish.
Gold price struggles near two-week lows below $2,900 in Friday’s Asian trading hours, looking to snap its eight consecutive weekly gains.
Gold price suffers amid US Dollar resurgence
Gold price is nursing losses as the US Dollar (USD) stands tall amid risk-off flows extending into Asia this Friday. Traders weigh the latest tariff threats from US President Donald Trump and the sharp decline in the American artificial intelligence (AI) leader Nvidia’s share price.
Trump confirmed on Thursday that his proposed 25% tariffs on Mexican and Canadian goods will take effect March 4 along with an extra 10% duty on Chinese imports as fentanyl continues to pour into the US from those countries.
His latest remarks brushed aside his Wednesday message that steep 25% tariffs on Mexican and Canadian goods could take effect on April 2.
The broader market sentiment also remains undermined due to heightening US economic concerns and the slump in Nividia and other so-called “Magnificent Seven” Wall Street mega-cap stocks, following the chipmaker’s discouraging earnings.
Data on Thursday showed that the second estimate of the fourth-quarter US Gross Domestic Product (GDP) held steady from the advance estimates, showing an annualised growth of 2.3% in Q4 2024. Meanwhile, the number of Americans filing for jobless benefits rose by 22,000 to 242,000 for the week ending Feb. 22, hitting the highest level in three months.
Against this background, the Greenback will likely keep the upper hand across the board, maintaining the downside pressure on the USD-denominated bright metal.
However, weak US economic data-led dovish Federal Reserve (Fed) interest rate cut expectations combined with increased safe-haven flows into the US government bonds remain a headwind for the US Treasury bond yields.
The benchmark 10-year US Treasury bond yields extend their losing streak, flirting with 11-week lows near 4.20% at the press time. The ongoing decline in the US yields could hinder the US Dollar recovery, cushioning the Gold price downside.
That said, the upcoming Fed’s preferred inflation gauge, the core Personal Consumption Expenditures (PCE) Price Index, will help trigger the next direction in Gold price. The annual US core PCE Price Index is set to rise 2.6% in January after increasing 2.8% in December. Any significant deviation from the forecast will likely impact the Fed rate cut bets, influencing the Greenback and the yellow metal.
Further, the end-of-the-month flows and more commentary from US President Trump could also play a pivotal role in driving the Gold price action as the week draws to a close.
Gold price technical analysis: Daily chart
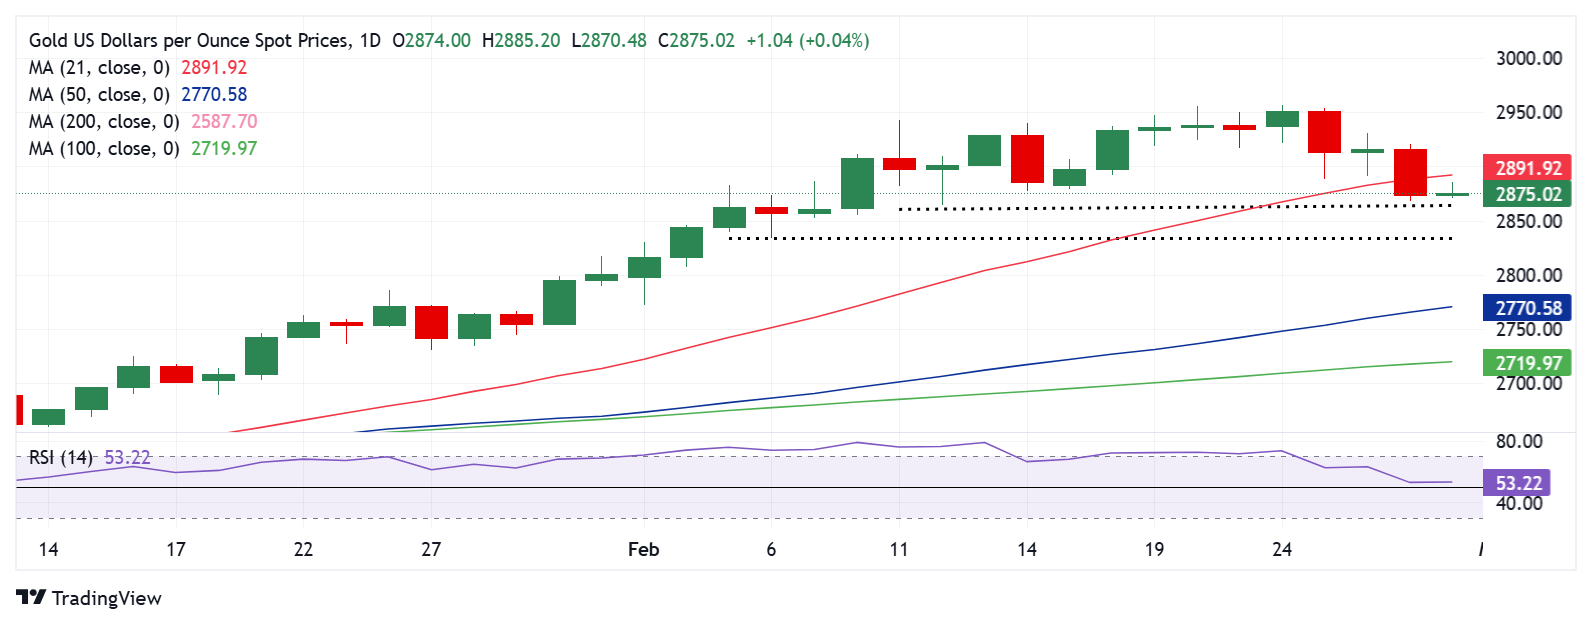
The daily chart shows that Gold price closed Thursday below the critical short-term support of the 21-day Simple Moving Average (SMA) at $2,890, inducing further downward pressure.
However, Gold price remains above the 14-day Relative Strength Index (RSI), currently near 53.50, indicating that buyers refuse to give up yet.
If sellers flex their muscles, the immediate support is seen at the February 12 low of $2,864, below which the $2,850 psychological barrier will be challenged.
Additional declines will threaten the February 6 low of $2,834.
Should Gold buyers seek a weekly closing above the 21-day SMA support-tuned resistance at $2,890, a fresh uptrend could be fuelled toward the February 26 high of $2,930.
The next upside target on buyers’ radars will be an all-time high at $2,956.
Economic Indicator
Core Personal Consumption Expenditures – Price Index (YoY)
The Core Personal Consumption Expenditures (PCE), released by the US Bureau of Economic Analysis on a monthly basis, measures the changes in the prices of goods and services purchased by consumers in the United States (US). The PCE Price Index is also the Federal Reserve’s (Fed) preferred gauge of inflation. The YoY reading compares the prices of goods in the reference month to the same month a year earlier. The core reading excludes the so-called more volatile food and energy components to give a more accurate measurement of price pressures.” Generally, a high reading is bullish for the US Dollar (USD), while a low reading is bearish.


