

XAU/USD Current price: $2,895.33
- US President Donald Trump revived tariffs-related concerns and spurred risk aversion.
- United States Consumer Confidence plummeted in February, recession concerns returned.
- XAU/USD turned bearish in the near term, could near the $2,800 region.
Spot Gold is on the back foot in the second half of Tuesday, trading below the $2,900 mark and trimming early weekly gains. The US Dollar (USD) gathered upward momentum after Wall Street’s opening, trading firmly, particularly against commodities and commodity-linked rivals. On the contrary, the USD is mildly weak against European rivals amid falling US Treasury yields. In the case of XAU/USD, the lack of upward progress towards fresh record highs triggered profit-taking.
Concerns gyrate around the United States (US) government’s planned tariffs. President Donald Trump brought back to the table levies on Canada, Mexico and China, saying that he plans to “move forward” after the announced one-month delay, adding that additional tariffs could soon reach Chinese products.
Trump Trade Adviser Peter Navarro, however, clarified that US authorities are negotiating with Mexico and Canada, adding that levies will depend on the progress of such negotiations.
Stock markets suffered since early Asia amid Trump hitting the tech sector, with menaces on imposing restrictions to Chinese semiconductors. As a result, the tech sector is the worst performer, with the Nasdaq Composite down roughly 330 points.
Further fueling the dismal mood, the US CB Consumer Confidence report showed consumers turned more pessimistic, as the index fell to 98.3 in February from 104.1 in January. It also missed expectations of 102.7 while showing Expectations plunged to 72.9, below the 80 mark that separates growth from recession.
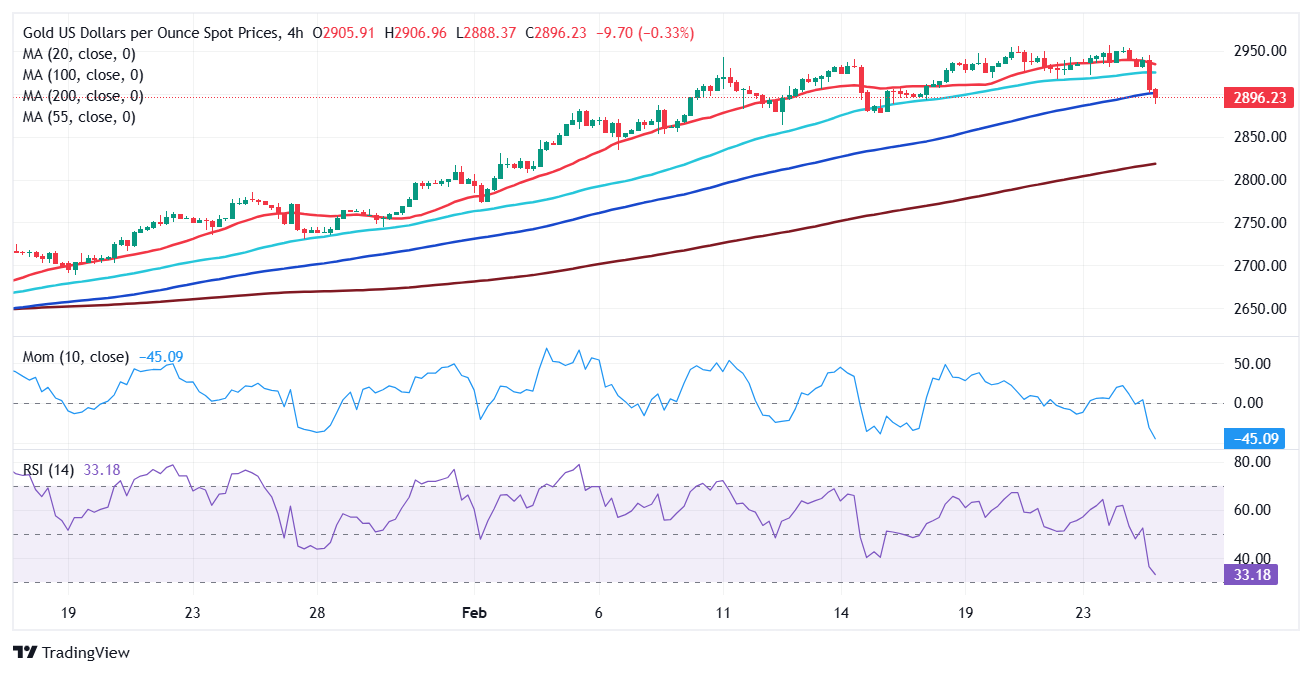
XAU/USD short-term technical outlook
The daily chart for the XAU/USD pair shows the bearish corrective decline could continue, particularly if the pair breaks below a bullish 20 Simple Moving Average (SMA), providing dynamic support at around $2,879.95. The 100 and 200 SMAs keep heading north far below the shorter one, limiting the potential of a sustained bearish move. Finally, technical indicators head south almost vertically, reflecting sellers’ strength yet holding above their midlines, which is not enough to confirm a steeper decline.
In the near term, and according to the 4-hour chart, the bearish case is firmer. XAU/USD plunged below a mildly bearish 20 SMA, now acting as dynamic resistance at around $2,936.20. At the same time, the pair is battling a bullish 100 SMA while technical indicators head firmly south near oversold readings. Should the pair clear the area around the mentioned 100 SMA, the slide could extend towards the next relevant level, January’s monthly high at $2,817.04.
Support levels: 2,879.95 2,863.60 2,855.45
Resistance levels: 2,908. 2,921.50 2,636.20


