

XAU/USD Current price: $3,049.60
- US President Trump’s threat of more tariffs takes its toll on the US Dollar.
- The United States will release PCE Price Index data on Friday.
- XAU/USD maintains its positive momentum near fresh record highs.
The broad US Dollar (USD) weakness helped XAU/USD resumed its advance, with the bright metal reaching a fresh record high at $3,059.67, in the American session.
Markets rushed away from the USD and into safety after United States (US) President Donald Trump came out with fresh tariffs threats. Trump announced new 25% levies on cars and car parts coming into the US late on Wednesday, while adding more tariffs could be imposed to the Eurozone (EU) and Canada. Taxes on vehicles will come into effect on April 3, while those on auto parts will come in May or later.
Canadian Prime Minister Mark Carney said that Trump’s new auto tariffs are “a direct attack” on the Canadian autoworkers. “We will defend our workers, we will defend our companies, we will defend our country, and we will defend it together,” Carney added.
The news negatively affected stock markets, which struggled to attract investors. Asian indexes ended the day mixed, although European ones ended the day mixed. As for US indexes, they also stand in the red.
Investors will now focus on upcoming US data. On Friday, the country will release the February Personal Consumption Expenditures (PCE) Price Index, the Federal Reserve (Fed )’s favorite inflation gauge. Core annual PCE is foreseen at 2.7%, slightly higher than the 2.6% posted in January.
XAU/USD short-term technical outlook
The XAU/USD pair maintains the upward pressure and aims to extend its advance, according to technical readings in the daily chart. The pair develops above all its moving averages, with a bullish 20 Simple Moving Average (SMA) picking up momentum and currently at around $2,968.40. At the same time, technical indicators resumed their advances within positive levels, in line with a higher high ahead.
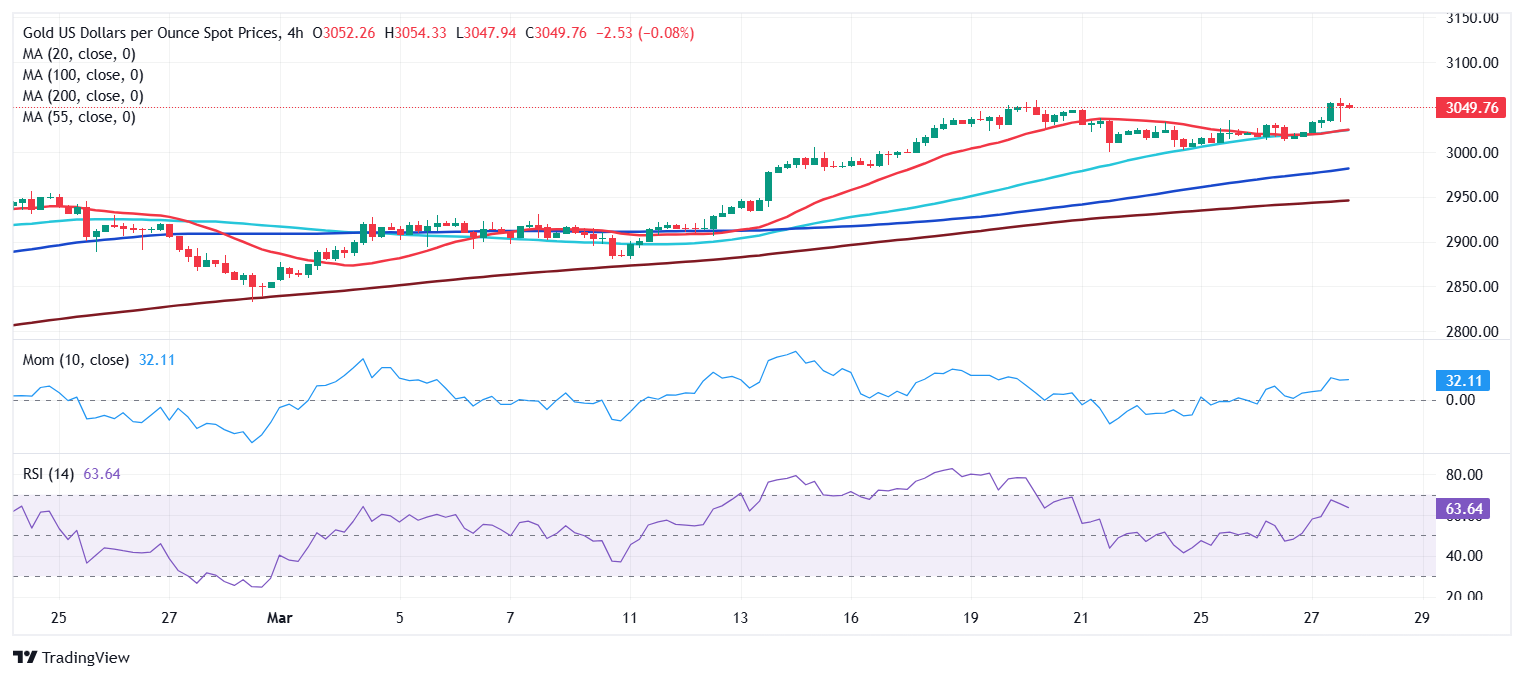
The near-term picture is bullish. XAU/USD extended its recovery above a now mildly bullish 20 SMA in the 4-hour chart, while the 100 and 200 SMAs advance below the shorter one. Finally, technical indicators head north above their midlines, with uneven upward strength, yet still reflecting prevalent buying interest.
Support levels: 3,030.50 3,0 23.14 2,999.30
Resistance levels: 3,060.00 3,075.00 3,090.00


