

United States
Securities
and Exchange Commission
Washington, D.C. 20549
FORM N-CSR
CERTIFIED SHAREHOLDER REPORT OF REGISTERED
MANAGEMENT INVESTMENT COMPANIES
811-07925
(Investment Company Act file number)
WesMark Funds
(Exact name of registrant as specified in charter)
One Bank Plaza, 5th floor
Wheeling, WV 26003
(Address of principal executive offices)
(304) 234-9000
(Registrant’s telephone number)
Nicholas Adams, Esq.
ALPS Fund Services, Inc.
1290 Broadway, Suite 1000
Denver, CO 80203
(Name and address of agent for service)
Date of fiscal year end: December 31
Date of reporting period: January 1 – December
31, 2023
Item 1. Reports to Stockholders.
| (a) | Report of the Shareholders. |
President’s Message
December 31, 2023
Dear fellow shareholders:
During 2023, the US economy continued to expand
in the face of tightening monetary conditions. While declining from the near-term highs, inflation readings remained well above the Federal
Reserve’s long-term target. In January 2023, the Consumer Price Index (CPI) was up 6.4% compared to the same period a year earlier.
The Federal Reserve’s favorite measure for inflation, the Personal Consumption Expenditure (PCE) Core Index, was up 4.9% compared
to January 2022. The year-over-year increase remained above the long-term target of 2.0%. As a result, the Federal Reserve continued to
increase rates for much of 2023.
As a reminder, the Federal Reserve has a dual
mandate of “price stability” and “maximum employment.” Since March 2022, the Federal Reserve has increased rates
to bring inflation down. Over this period, Fed Funds rates have increased 11 times, raising the top end of their range to 5.5%. During
2023, the rate of change slowed with respect to increases. In 2022, the Federal Reserve aggressively increased rates by 0.50% and 0.75%.
As inflation moderated in 2023, the pace of change slowed to 0.25% increases. These finally paused following the Federal Reserve’s
July meeting. During the final three meetings of the year, the Federal Reserve reiterated their commitment on remaining data dependent.
The aggressive actions by the Federal Reserve
did not negatively affect employment readings during the year. The pace of hiring slowed throughout 2023, with January’s 472,000
new jobs added marking the highest reading of the year. Through November, the US added 2.48 million nonfarm jobs. However, the unemployment
rate ticked up slightly for the year, beginning at 3.4% and briefly touching 3.80% in October. The increase in the unemployment rate was
largely due to an increase in the labor force participation. In addition to fewer hirings during the year, the number of job openings
also declined throughout much of 2023. As measured by the Bureau of Labor Statistics, the number of job openings fell from 11.2 million
to 9.0 million during the year.
Despite elevated inflation readings, aggressive
rate hikes, and a slowing labor market, the US economy continued to expand during 2024. The third quarter Gross Domestic Product (GDP)
increased by 4.9%, its highest reading since the fourth quarter of 2021. Strong consumer spending and business investment led third quarter
GDP growth. Spending levels were supported by solid wage gains and excess stimulus savings, both of which moderated during the year.
Despite a resilient US economy and consumer, earnings
growth for S&P 500 Index companies was below historical averages for 2023. As a result, much of the gain for the year was driven by
an expansion of the multiple that investors were willing to pay. The S&P 500 Index began 2023 trading at a trailing price-to-earnings
multiple of 18.2 and finished the year at 22.9. For 2023, the S&P 500 Index was up by 26.3% while the Russell 2000 Index rose by 16.9%.
Domestic equity markets once again produced returns that were higher than their international peers. Developed international equities,
as measured by the MSCI EAFA Index, rose 18.9%, and the MSCI Emerging Markets Index gained 10.1% over the same period.
The yield on the 10 year Treasury began and ended
the year around 3.80%. However, that does not mean that fixed-income markets were unchanged for the year. The 10-year Treasury yield rose
above 4.00% in early March, as the Federal Reserve reiterated its commitment on fighting inflation. The early March level was the first
time the 10 year Treasury was above 4.00% going back to 2008. However, as concerns about regional banks’ liquidity positions gathered
momentum, the benchmark yield dropped to 3.30%. As these concerns moderated and the Federal Reserve continued to raise rates, the 10 year
Treasury yield moved higher. After briefly touching 5.00% in October, the highest reading in 16 years, it drifted back to 3.88% by the
end of the year. For the full year, the Bloomberg Barclay’s Government/Credit Index rose by 5.72%.
Your investment in WesMark Funds is important
to us. As always, we thank you. We strive to provide a competitive result to you, our investors. Our investment in the resources necessary
to execute a successful investment plan for all our funds is always top of mind. Your support is instrumental to this success.
Should you have any questions or need additional
information about the Funds, please visit our website at www.wesmarkfunds.com or call 1-800-864-1013.
Sincerely,

Scott Love, CAIA, CIMA®
President, WesMark Funds
| www.wesmarkfunds.com |  |

Table of Contents
December 31, 2023
| Management’s Discussion of Fund Performance | |
| Small Company Fund | 2 |
| Large Company Fund | 5 |
| Balanced Fund | 8 |
| Government Bond Fund | 11 |
| West Virginia Municipal Bond Fund | 14 |
| Tactical Opportunity Fund | 17 |
| Small Company Fund | |
| Portfolio of Investments Summary Table | 20 |
| Portfolio of Investments | 21 |
| Large Company Fund | |
| Portfolio of Investments Summary Table | 25 |
| Portfolio of Investments | 26 |
| Balanced Fund | |
| Portfolio of Investments Summary Table | 29 |
| Portfolio of Investments | 30 |
| Government Bond Fund | |
| Portfolio of Investments Summary Table | 36 |
| Portfolio of Investments | 37 |
| West Virginia Municipal Bond Fund | |
| Portfolio of Investments Summary Table | 41 |
| Portfolio of Investments | 42 |
| Tactical Opportunity Fund | |
| Portfolio of Investments Summary Table | 46 |
| Portfolio of Investments | 47 |
| Statements of Assets and Liabilities | 48 |
| Statements of Operations | 49 |
| Statements of Changes in Net Assets | 50 |
| Financial Highlights | 53 |
| Notes to Financial Statements | 59 |
| Report of Independent Registered Public Accounting Firm | 71 |
| Shareholder Expense Example | 72 |
| Board of Trustees and Trust Officers | 73 |
| Statement Regarding the Liquidity Risk Management Program | 75 |
| Additional Information | 76 |
| Glossary of Terms | 77 |
| Annual Report » December 31, 2023 | |
Management’s Discussion of Fund Performance
| WesMark Small Company Fund | December 31, 2023 (Unaudited) |
The Russell 2000 Index finished 2023 up 16.9%,
marking the strongest year for domestic small-caps since 2020. However, volatility was abound, especially in the second half of the year.
The year was defined by higher-than-expected rate
increases, as the Federal Reserve steadily raised rates to combat inflation. Initial consensus expectations pegged the Fed Funds Target
Rate at 4.5% to exit 2023, well-below the year-end realized reading of 5.5%. The increase in rates disproportionately impacted small-cap
companies, as they tend to carry more leverage and have higher floating-rate exposure.
By the end of 2023, the Russell 2000 Index had
a net debt to EBITDA of 4.5, notably higher than the S&P 500’s 1.4. As the US Treasury 10-year yield eclipsed 5% in October,
the Russell 2000 dropped nearly 19% from its peak in July. However, as the recovery in rates faded, the Index rallied back over 19% from
trough to peak.
Earnings fell sharply in the second quarter, down
over 20% year-over-year, but returned to growth in the second half. The forward price to earnings ratio averaged 26.6 in 2023, near the
long-term average of 25.4. As the year finished, the Russell 2000 Index closed with a forward price to earnings ratio of 32.6.
Over the past year, the WesMark Small Company
Fund (“the Fund”) posted a gain of 19.5%, outperforming the Russell 2000 Index (+16.9%) and the Lipper Small-Cap Core Fund
category (+15.7%). Over the past five years, the Fund earned an average annual total return of 14.0% versus 9.9% for the Russell 2000
Index and 10.9% for the Lipper Small-Cap Core Fund category.
Relative performance can be measured by both sector
allocation decisions and stock selection. Despite the outperformance in the year, sector allocation detracted from overall performance.
The Fund remained overweight to the Financials sector through the downturn in the first half of 2023.
An underweight allocation to the Consumer Discretionary
sector also impacted returns, as the sector rebounded more strongly after October lows. From a sector perspective, security selection
was strongest in the Consumer Staples and Technology sectors. M&A played an important role in performance and pricing power remained
steady. The Industrial sector within the Fund also performed well, supported by continued fiscal spending and a focus on end markets with
long-term tailwinds.
Over the past several years, individual holding
performance, coupled with our near-term investment views, have resulted in several sectors having allocations that were above the benchmark.
During 2023, we shifted allocations to better
reflect our near-term views. As a result, the allocation to Industrials decreased from 28.2% to 22.4%, and the allocation to Financials
decreased from 23.5% to 17.3%. To take advantage of the strong US consumer and falling inflation, we increased exposure to Consumer Discretionary
from 1.9% to 8.8% and increased exposure to the Consumer Staples sector from 2.2% to 6.1%.
The Fund’s largest sector allocation in
2023 remained Industrials. The Fund’s allocation returned 30.8%, outperforming the Russell 2000 Industrial sector( 27.0%) and the
index overall.
The weighting to the sector in the Fund was 22.4%,
above the Russell 2000 Index weighting of 18.4%. The continued disbursement of infrastructure spending supported the sector overall, as
well as increased global defense spend with the Russian/Ukraine and Israel/Hamas conflicts. Defense supplier and commercial airline supplier
Moog Inc. led returns for the sector, followed by Quanta Services, Evoqua Water Technologies, and AAON Inc.
The Financials sector was the second largest weighting
in the Fund, returning 4.8% for the year. It underperformed the Russell 2000 Financial sector performance of 11.2%. Overweight positions
in regional banks led to the bulk of underperformance, as BankUnited Inc., TrustMark Corp. and Ameris Bancorp all finished the first quarter
down more than 20%.
The regional banking crisis, led by concerns about
the impact of the swift increase in interest rates, ultimately fueled contracting deposits for regional banks in the first half of 2023.
As the year progressed, the Fund increased allocations to capital markets and insurance exposure, which led returns with Stifel Financial
Corp. and Jackson Financial Inc..
The Information Technology sector represented
17.9% of the Fund, well-above the Russell 2000 Index weighting of 12.6%. Performance in the sector for the Fund outpaced the benchmark,
up 34.9% on the year versus the Russell 2000 technology up 28.1%. Two notable trends led the Technology sector in 2023: (1) the adoption
of artificial intelligence for both commercial and enterprise use and (2) the increase in demand for security software as cyber attacks
continued to increase. The best performing holdings were Varonis Systems Inc., Celestica Inc., and Qualys Inc.
The largest sector allocation increase for the
Fund during 2023 was in the Consumer Staples sector, which represented over 6% weighting. This is well-above the Russell 2000 Index weighting
of 2.8%. Total return for the sector in the fund was the most significant versus the benchmark, up 70.6% versus 19.3% for the Russell
2000 Consumer Staples sector.
Performance was led by Elf Beauty Inc., Hostess
Brands, Inc., and Sovos Brands Inc. The latter two were both acquired by larger competitors for sizeable premiums.
In terms of absolute performance, the Health Care
sector for the Fund returned 8.5%. This was above the benchmark return of 7.8%. The Energy sector exhibited a 0.9% loss for the year for
the Fund, underperforming the benchmark, which rose 12.1%. Energy prices remained weak throughout 2023.
The top 10 holdings accounted for nearly two-thirds of the total return.
The Fund saw sizeable gains in Varonis Systems Inc. (88.6%) and Moog Inc. (66.6%). The Fund’s top 10 holdings accounted for 28.3%
of its overall market value.
| 2 |  |
www.wesmarkfunds.com |
Management’s Discussion of Fund Performance
| December 31, 2023 (Unaudited) | WesMark Small Company Fund |
TOP 10 EQUITY HOLDINGS
| % of Total | |
| Security Name | Net Assets |
| Quanta Services, Inc. | 4.6% |
| Varonis Systems, Inc. | 3.9% |
| Stifel Financial Corp. | 3.7% |
| Moog, Inc. | 3.7% |
| Applied Industrial Technologies, Inc. | 2.3% |
| AAON, Inc. | 2.2% |
| Elanco Animal Health, Inc. | 2.0% |
| First Bancorp/Southern Pines, NC | 2.0% |
| Box, Inc. | 1.9% |
| Korn Ferry | 1.8% |
| Total Net Assets | 28.1% |
Also see Glossary of Terms on page 77.
Performance data quoted represents past performance which is
no guarantee of future results.
Diversification does not eliminate the risk of experiencing investment
losses.
An investment in the Fund involves risk,
including loss of principal. Investment in the Fund is subject to investment risks, including, without limitation, market risk, credit
risk, interest rate risk, risks related to ETF net asset value and market price, foreign securities risk, commodity risk, manager risks,
risks of investing in real estate investment trust (REITs), and risks related to company size.
The views in this report were those of the
Fund Managers as of the letter’s publication date and may not reflect his views on the date this letter is first distributed or
anytime thereafter. These views are intended to assist readers in understanding the Fund’s investment methodology and do not constitute
investment advice.
Lipper, Inc., a Reuters company, is a
nationally recognized organization that ranks the performance of mutual funds within a universe of funds that have similar
investment objectives. Rankings are historical and are based on total return with capital gains and dividends reinvested. For the
10-, 5-, 3- and 1- year periods, the Small Company Fund was ranked 223 out of 657, 70 out of 893, 676 out of 956, and 171 out of 994
as of 12/31/2023 in the Small Cap Core Funds category. Lipper does not guarantee the accuracy of this information. Lipper rankings
are not intended to predict future results.
| Annual Report | December 31, 2023 | |
3 |
Management’s Discussion of Fund Performance
| WesMark Small Company Fund | December 31, 2023 (Unaudited) |
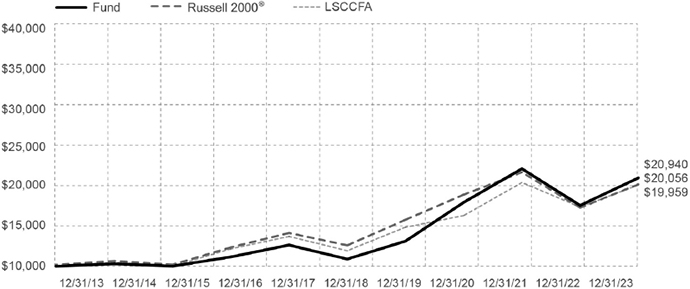
GROWTH of $10,000 invested in WesMark Small Company Fund
The graph below illustrates the hypothetical
investment of $10,000* in the WesMark Small Company Fund (the “Fund”) from December 31, 2013 to December 31, 2023, compared
to the Russell 2000® Index (“Russell 2000®”)** and the Lipper Small-Cap Core Funds Average
(“LSCCFA”).***
AVERAGE ANNUAL TOTAL RETURN for the periods ended December 31, 2023
| 1 Year | 5 Years | 10 Years |
| 19.46% | 13.96% | 7.67% |
Total Annual Fund Operating Expense (as of most current Prospectus):
1.25%
Performance data quoted represents past
performance which is no guarantee of future results. Investment return and principal value will fluctuate so that an investor’s
shares, when redeemed, may be worth more or less than their original cost. Mutual fund performance changes over time and current performance
may be lower or higher than what is stated. For current to the most recent month end performance and after-tax returns call 1-800-864-1013.
Returns shown do not reflect the deduction of taxes that a shareholder would pay on Fund distributions or the redemption of Fund shares.
Mutual funds are not obligations of or guaranteed by any bank and are not federally insured.
Small-company stocks may be less liquid and subject to greater price
volatility than large capitalization stocks.
| * | Represents a hypothetical investment of $10,000 in the Fund. The Fund’s performance assumes the reinvestment of all dividends and distributions. The Russell 2000® and LSCCFA have been adjusted to reflect reinvestment of dividends on securities in the index and average. |
| ** | The Russell 2000® measures the performance of the 2,000 smallest companies in the Russell 3000® Index, which represents approximately 10% of the total market capitalization of the Russell 3000® Index. The index is unmanaged and unlike the Fund, is not affected by cash flows. The Russell 2000® is not adjusted to reflect sales charges, expenses, or other fees that the Securities and Exchange Commission (SEC) requires to be reflected in the Fund’s performance. It is not possible to invest directly in an index. |
| *** | The information presented for the LSCCFA is the average of the total returns of the 30 largest qualifying mutual funds (based on net assets) in the Lipper Small-Cap classification. Lipper averages do not reflect sales charges. It is not possible to invest directly in an average. |
| 4 | |
www.wesmarkfunds.com |
Management’s
Discussion of Fund Performance
| December 31, 2023 (Unaudited) | WesMark Large Company Fund |
The WesMark Large Company (“the Fund”)
returned 21.9% for the period compared to the Lipper Large-Cap Core Funds category average return of 24.3%.
Growth stocks outpaced the market with the S&P
500 Growth Index up 30.0% ahead of the S&P 500 Value Index up 22.2%. Returns were led by seven of the larger market capitalization
names within the S&P 500 Index, often referred to as the “Magnificent Seven.” Apple, Alphabet, Amazon, Meta Platforms,
Microsoft, Nvidia, and Tesla. They collectively accounted for roughly 60% of the S&P 500 Index’s return in 2023.
The S&P 500 Index performance was led by three
sectors: Information Technology (+57.8%), Communication Services (+55.8%), and Consumer Discretionary (+42.4%). The worst performing sectors
included Utilities (-5.2%), Energy (-1.3%), and Consumer Staples (+0.5%).
The Fund’s overweight allocation relative
to the S&P 500 Index Information Technology sector contributed to performance. The Fund ended 2023 with a 28.8% weighting equal to
that of the S&P 500 Information Technology weight.
For the year, information technology stocks in
the Fund gained 56.0%, though this was slightly below the 57.8% return of the S&P 500 Information Technology Index.
Several positions rebounded from weak performance
in 2022. Crowdstrike (+145.1%), Advanced Micro Devices (+131.8%), Broadcom (+104.7%), and Salesforce (+98.5%) led the way. Investors looked
for the potential return in artificial intelligence, as the subject captured the public’s attention last spring. Enphase Energy
(-51%) negatively impacted performance, as the outlook for solar companies has become more uncertain.
The Fund’s allocation to the Communication
Services sector increased from 4.5% to 8.1% due to strong performance and new positions. The S&P 500 Communications Services Index
gained 55.8% over the past twelve months. The Fund underperformed with a return of 42.2%. Match Group (-26.5%) and ZoomInfo Technologies
(-14.8%) contributed to the underperformance. Both stocks were sold over the year. The proceeds were re-allocated to Spotify and Meta
Platforms.
The Consumer Discretionary sector saw underperformance.
The Fund returned 39.8% compared to 42.2% for the S&P 500 Consumer Discretionary Index. Stocks performed well as consumers sustained
retail spending. The Fund had solid performance from overweight positions in Amazon (+80.9%), Chipotle Mexican Grill (+64.0%), and Lululemon
(+61.5%). The Fund’s holdings in LKQ Corp and Tractor Supply Company negatively affected performance.
In the Health Care sector, stock selection was
positive to overall performance. The Fund gained 4.6% compared to the 2.1% return of the S&P 500 Health Care Index. The above benchmark
allocation to the sector at the beginning of 2023 was reduced during the year. The Fund began the year with a 22.4% stake in the sector,
moving to a 15.8% exposure as of December 31, 2023. The year-end allocation remained above the 12.6% Health Care sector weight within
the S&P 500 Index. Health Care remains the Fund’s largest overweight as valuations remain attractive with potential for above
market earnings growth over the next several years. Zoetis (+35.7%) and Vertex Pharmaceuticals (+23.3%) were the Fund’s best performers.
The Fund added value in Consumer Staples by being
underweight and from stock selection for the year. Consumer Staples underperformed the S&P 500 Index for 2023. Historically, the sector
is more interest rate sensitive. In a rising rate environment, these companies can trail the overall benchmark. The Fund was positively
impacted by selection as the Fund’s holdings posted a total return of 4.1%. Mondelez International (+11.3%) and Constellation Brands
(+5.9%) were the top performers.
In Financials, an underweight relative to the
benchmark helped performance while stock selection distracted. The Fund’s holdings in the financial sector returned 5.8% versus
the S&P 500 Financial Index gain of 12.1%. Offsetting the negative returns was strong performance from Fifth Third (+33.3%), Marsh
& McClendon (+27.1%), and JP Morgan (+22.8%).
The top 10 names accounted for 41.4% of the overall
market value of the Fund. The benchmark S&P 500 Index saw much higher return from mega-cap stocks and approached record levels as
we closed out 2023.
During 2023, the Fund made limited use of derivatives, such as options. As a result, derivatives had no material impact on the Fund’s
performance.
| Annual Report | December 31, 2023 | |
5 |
Management’s Discussion of Fund Performance
| WesMark Large Company Fund | December 31, 2023 (Unaudited) |
TOP 10 EQUITY HOLDINGS
| % of Total | |
| Security Name | Net Assets |
| Apple, Inc. | 7.5% |
| Microsoft Corp. | 6.2% |
| Amazon.com, Inc. | 5.6% |
| Alphabet, Inc. | 4.6% |
| Mastercard, Inc. | 3.5% |
| Broadcom, Inc. | 3.2% |
| UnitedHealth Group, Inc. | 3.1% |
| Home Depot, Inc. | 2.8% |
| Abbott Laboratories | 2.5% |
| Thermo Fisher Scientific, Inc. | 2.4% |
| Total Net Assets | 41.4% |
Also see Glossary of Terms on page 77.
Performance data quoted represents past performance which is
no guarantee of future results.
Diversification does not eliminate the risk of experiencing investment
losses.
An investment in the Fund involves risk,
including loss of principal. Investment in the Fund is subject to investment risks, including, without limitation, market risk, credit
risk, interest rate risk, risks related to ETF net asset value and market price, foreign securities risk, commodity risk, manager risks,
risks of investing in real estate investment trust (REITs), and risks related to company size.
The views in this report were those of the
Fund Managers as of the letter’s publication date and may not reflect his views on the date this letter is first distributed or
anytime thereafter. These views are intended to assist readers in understanding the Fund’s investment methodology and do not constitute
investment advice.
Lipper, Inc., a Reuters company, is a
nationally recognized organization that ranks the performance of mutual funds within a universe of funds that have similar
investment objectives. Rankings are historical and are based on total returns with capital gains and dividends reinvested. For the
10-, 5-, 3- and 1- year periods, the Large Company Fund was ranked 390 out of 431, 379 out of 557, 570 out of 613, and 480 out of
672 as of 12/31/2023 in the Large Cap Core Funds category. Lipper does not guarantee the accuracy of the information. Lipper
rankings are not intended to predict future results.
| 6 | |
www.wesmarkfunds.com |
Management’s
Discussion of Fund Performance
| December 31, 2023 (Unaudited) | WesMark Large Company Fund |
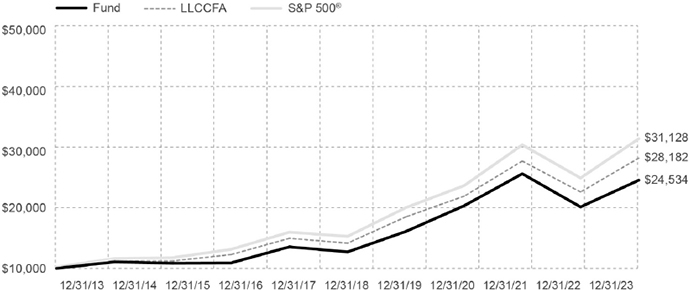
GROWTH of $10,000 invested in WesMark Large Company Fund
The graph below illustrates the hypothetical
investment of $10,000* in the WesMark Large Company Fund (the “Fund”) from December 31, 2013 to December 31, 2023, compared
to the Standard and Poor’s 500® Index (“S&P 500®”)** and Lipper Large-Cap Core Funds
Average (“LLCCFA”).***
AVERAGE ANNUAL TOTAL RETURN for the periods ended December 31, 2023
| 1 Year | 5 Years | 10 Years |
| 21.94% | 14.06% | 9.39% |
Total Annual Fund Operating Expense (as of most current Prospectus):
1.14%
Performance data quoted represents past
performance which is no guarantee of future results. Investment return and principal value will fluctuate so that an investor’s
shares, when redeemed, may be worth more or less than their original cost. Mutual fund performance changes over time and current performance
may be lower or higher than what is stated. For current to the most recent month end performance and after-tax returns call 1-800-864-1013.
Returns shown do not reflect the deduction of taxes that a shareholder would pay on Fund distributions or the redemption of Fund shares.
Mutual funds are not obligations of or guaranteed by any bank and are not federally insured.
| * | Represents a hypothetical investment of $10,000 in the Fund. The Fund’s performance assumes the reinvestment of all dividends and distributions. The S&P 500® and LLCCFA have been adjusted to reflect reinvestment of dividends on securities in the index and average. |
| ** | The S&P 500® measures the performance of 500 large-cap U.S. companies. The S&P 500 is not adjusted to reflect sales charges, expenses or other fees that the SEC requires to be reflected in the Fund’s performance. The index is unmanaged and unlike the Fund, it is not affected by cash flows. It is not possible to invest directly in an index. |
| *** | The information presented for the LLCCFA is the average of the total returns of the 30 largest qualifying mutual funds (based on net assets) in the Lipper Large-Cap classification. Lipper averages do not reflect sales charges. It is not possible to invest directly in an average. |
| Annual Report | December 31, 2023 | |
7 |
Management’s Discussion of Fund Performance
| WesMark Balanced Fund | December 31, 2023 (Unaudited) |
The WesMark Balanced Fund (the Fund) provided
a total return of 5.0% for the year ended December 31, 2023, compared to the Lipper Balanced Fund category average return of 15.6%.
The Fund seeks to achieve capital appreciation
and income by allocating its assets primarily among fixed-income and equity securities. The Fund began the year with 37.7% in fixed-income
and cash equivalents. Given the move in yields and equity market volatility during the year, we reduced our equity allocation as long-term
yields increased in the second and third quarter. The asset allocation at year end was 39.3% in fixed-income, 60.3% in common equity,
and 0.5% in cash equivalents. From a style perspective, value stocks underperformed the broad markets for much of the year. For 2023,
the S&P 500 Growth Index gained 30.0% while the S&P 500 Value Index increased by 22.2%.
With 5.25% in cumulative rate increases since
March 2022, The Federal Reserve pivoted in the second half of 2023. It indicated that the battle to tame inflation was progressing and
further rate hikes were less likely needed. In October, the 10-year US Treasury bond rose to 5.00% as investors and the Federal Reserve
remained concerned that inflation may reaccelerate, resulting in further increases in rates. Bond market investors and the Federal Reserve
would later signal an end to rate hikes, as well as suggest potential rate cuts in 2024. The bond market rallied leaving the 10-year Treasury
yield at 3.88% by year end. The reading was unchanged from where yields began the year.
During 2023, yields on the 10-year Treasury reached
their highest readings since 2007. The fixed income allocation gained 6.3%, outperforming the Bloomberg Intermediate Government/Credit
Index, which rose by 5.2% within 2023. The Fund extended duration in the second half of the year as higher rates became more compelling.
The Fund’s fixed-income duration was 4.9 years at the end of 2023 compared to 3.3 years on December 31, 2022. That compares to the
fixed-income benchmark duration of 3.8 years. All fixed-income securities held in the Fund at year end remained investment grade as determined
by a nationally recognized statistical rating organization. The largest exposure in the fixed-income allocation was corporate debt. This
provided a return for the Fund’s fixed-income sector of 7.0%. taxable municipal bonds provided a return of 7.4% for the year. The
Fund’s fixed-income structure moved to a position to benefit from a falling interest rate environment and a steeper yield curve.
The equity allocation returned 6.3%,
underperforming the S&P 500 Index’s full-year return of 26.3%. The Fund’s bias towards high-dividend yield stocks
negatively affected performance. An index of higher yielding stocks, the S&P 500 High Dividend Index, reported a total return of
4.0% during 2023.
The Health Care sector was the largest overweight
relative to the S&P 500 Index. For the period, the Fund return 2.0% compared to 2.1% in the S&P 500 Health Care sector. The performance
was mixed. Eli Lilly (+60.2%) benefited from sales of a new weight loss drug while Pfizer (–41.2%) took a Covid-related write-off
and lowered sales expectations. The fund reduced its health care allocation, ending 2023 with a 21.6% equity allocation. This compares
to the 12.6% in the S&P 500 Health care sector.
Of the equity allocation, the S&P 500 Financial
sector started the year at 17.5% of the Fund’s equity holdings and ended the year at 11.0%. This was compared to 12.9% for the S&P
500 Index on December 31, 2023. The move was based on our forecast for more difficult earnings as short-term rates moved higher. The S&P
500 Financial Sector Index returned 12.1% compared to the funds 8.2% return, security selection did not exceed the sector benchmark. Underperformance
came from holdings in Cullen Frost (-20.7%) and Discover Financial Services (-6.6%). This was partially offset by gains in JP Morgan (+30.5%)
and Goldman Sachs (+15.9%).
At year-end, the S&P 500 Information Technology
sector accounted for 20.2% of the equity portfolio, compared to 28.8% in the S&P 500 Index. The Fund’s holdings gained 28.2%,
underperforming the S&P 500 Information Technology sector’s returns of 57.8%. For the year, Apple (+48.6%) was the best performing
stock in the sector.
The Fund’s top 10 holdings accounted for
30.4% of its overall market value. In addition to the strong performers mentioned above, the Fund saw sizable gains in RPM Inc. (+35.4%)
and Caterpillar (+26.0%).
During 2023, the Fund made limited use of derivatives, such as options. As a result, derivatives had no material impact on the Fund’s
performance.
| 8 | |
www.wesmarkfunds.com |
Management’s Discussion of Fund Performance
| December 31, 2023 (Unaudited) | WesMark Balanced Fund |
TOP 10 EQUITY HOLDINGS
| % of Total | |
| Security Name | Net Assets |
| Apple, Inc. | 5.8% |
| Chevron Corp. | 3.3% |
| AbbVie, Inc. | 3.1% |
| Eli Lilly & Co. | 3.0% |
| Cisco Systems, Inc. | 3.0% |
| Caterpillar, Inc. | 2.6% |
| PepsiCo, Inc. | 2.6% |
| CVS Health Corp. | 2.4% |
| Texas Instruments, Inc. | 2.3% |
| JPMorgan Chase & Co. | 2.3% |
| Total Net Assets | 30.4% |
Also see Glossary of Terms on page 77.
Performance data quoted represents past performance which is
no guarantee of future results.
Diversification does not eliminate the risk of experiencing investment
losses.
An investment in the Fund involves risk,
including loss of principal. Investment in the Fund is subject to investment risks, including, without limitation, market risk, credit
risk, interest rate risk, risks related to ETF net asset value and market price, foreign securities risk, commodity risk, manager risks,
risks of investing in real estate investment trust (REITs), and risks related to company size.
The views in this report were those of the
Fund Managers as of the letter’s publication date and may not reflect his views on the date this letter is first distributed or
anytime thereafter. These views are intended to assist readers in understanding the Fund’s investment methodology and do not constitute
investment advice.
Lipper, Inc., a Reuters company, is a nationally
recognized organization that ranks the performance of mutual funds within a universe of funds that have similar investment objectives.
Rankings are historical and are based on total return with capital gains and dividends reinvested. For the 10-, 5-, 3-, and 1-year periods,
the Balanced Fund was ranked 108 out of 297, 194 out of 377, 90 out of 402, and 417 out of 423 as of 12/31/2023 in the Balanced Funds
category. Lipper does not guarantee the accuracy of this information. Lipper rankings are not intended to predict future results.
| Annual Report | December 31, 2023 | |
9 |
Management’s Discussion of Fund Performance
| WesMark Balanced Fund | December 31, 2023 (Unaudited) |
GROWTH of $10,000 invested in WesMark Balanced Fund
The graph below illustrates the hypothetical
investment of $10,000* in the WesMark Balanced Fund (the “Fund”) from December 31, 2013 to December 31, 2023, compared to
the Standard and Poor’s 500® Index (“S&P 500®”)**, the Barclays Capital Intermediate
U.S. Government/Credit Index (“BCIGCI”)***, the Lipper Balanced Funds Average (“LBFA”)****, and a combined index
consisting of 60% S&P 500® and 40% BCIGCI (“Balanced Composite Index”)*****.
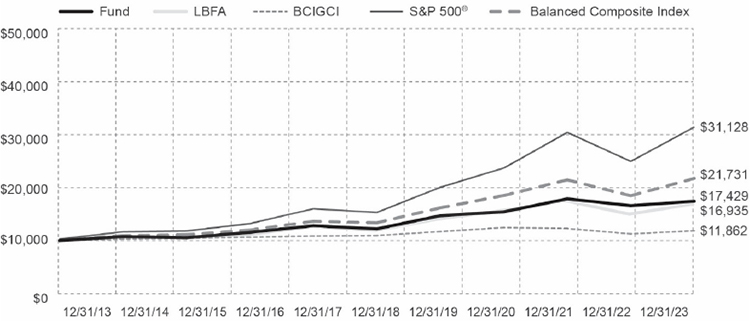
AVERAGE ANNUAL TOTAL RETURN for the periods ended December 31, 2023
| 1 Year | 5 Years | 10 Years |
| 4.98% | 7.36% | 5.71% |
Total Annual Fund Operating Expense (as of most current Prospectus):
1.25%
Performance data quoted represents past
performance which is no guarantee of future results. Investment return and principal value will fluctuate so that an investor’s
shares, when redeemed, may be worth more or less than their original cost. Mutual fund performance changes over time and current performance
may be lower or higher than what is stated. For current to the most recent month end performance and after-tax returns call 1-800-864-1013.
Returns shown do not reflect the deduction of taxes that a shareholder would pay on Fund distributions or the redemption of Fund shares.
Mutual funds are not obligations of or guaranteed by any bank and are not federally insured.
Bond prices are sensitive to changes in interest rates and a rise
in interest rates can cause a decline in their prices.
| * | Represents a hypothetical investment of $10,000 in the Fund. The Fund’s performance assumes the reinvestment of all dividends and distributions. The S&P 500®, BCIGCI, LBFA, and Balanced Composite Index have been adjusted to reflect reinvestment of dividends on securities in the index and average. |
| ** | The S&P 500® measures the performance of 500 large-cap U.S. companies. The S&P 500 is not adjusted to reflect sales charges, expenses or other fees that the SEC requires to be reflected in the Fund’s performance. The index is unmanaged and unlike the Fund, it is not affected by cash flows. It is not possible to invest directly in an index. |
| *** | The BCIGCI is an unmanaged market value weighted performance index for government and corporate fixed rate debt issues with maturities between one and ten years. The BCIGCI is not adjusted to reflect sales charges, expenses or other fees that the SEC requires to be reflected in the Fund’s performance. The index is unmanaged and unlike the Fund, is not affected by cash flows. It is not possible to invest directly in an index. |
| **** | The information presented for the LBFA is the average of the total returns of the 30 largest U.S. Balanced Funds. Lipper averages do not reflect sales charges. It is not possible to invest directly in an average. |
| ***** | The Balanced Composite Index is an unmanaged index, comprised 60% S&P 500® and 40% BCIGCI, and unlike the Fund, is not affected by cash flows. The Balanced Composite Index is not adjusted to reflect sales charges, expenses or other fees that the SEC requires to be reflected in the Fund’s performance. It is not possible to invest directly in an index or average. |
| 10 | |
www.wesmarkfunds.com |
Management’s Discussion of Fund Performance
| December 31, 2023 (Unaudited) | WesMark Government Bond Fund |
The Federal Reserve slowed and has likely ended
its most aggressive tightening campaign since the 1980s. Following the Federal Reserve’s seven consecutive interest rate increases
throughout 2022, it imposed another four rate hikes in 2023.
This brought the top end of the federal funds
target range to 5.50%. This was its highest level since 2000. Within the report period, inflation slowed at a steady pace while economic
growth remained strong. The Federal Reserve’s preferred inflation measure, the core PCE Index, declined to 2.9% in December from
4.9% to start 2023. The US economy remained resilient within the period as GDP expanded 2.5%. Approximately 2.7 million jobs were created,
and unemployment averaged 3.6%.
Despite the resilient U.S. economy, favorable inflation
backdrop, and the Federal Reserve pivoting toward a more dovish stance, the US Treasury interest rate curve remained inverted. The interest
rate differential between the 2 year US Treasury and the 10 year US Treasury started the period at -55 basis points. The inversion of
the US Treasury Yield curve deepened to -107 basis points in March 2023 amid regional banking concerns. This was the deepest inversion
of the US Treasury yield curve since 1980. It then ended the year at -37 basis points.
Last year was characterized by interest rate volatility.
At the beginning of the period, the yield on the 10 year US Treasury was 3.88%. The yield declined 57 basis points to 3.31% in April with
the collapse of Silicon Valley Bank and Signature Bank. Given the significant amount of US Treasury issuance, waning foreign demand, and
the Federal Reserve’s declining balance sheet, the yield on the 10 year U.S. Treasury increased 168 basis points. It peaked mid-October
at 4.99%, the highest level since 2007.
The elevated interest rate environment was short-lived.
The yield on the 10 year US Treasury declined 111 basis points to end the period at 3.88%, the same yield at which it began the year.
The year-end rally was a result of improving inflation data.
The U.S. Treasury also deceided to shift its debt
issuance in its quarterly refunding. This would go toward U.S. Treasury bills rather than longer-dated U.S. Treasury bonds. These caused anxiety
in the US Treasury auction market.
With on-going, elevated fiscal deficits, Fitch
Rating Agency lowered its credit rating on the U.S. government debt to AA+ in August. This change was over deficit and governance concerns.
Moody’s maintained the U.S. rating at AAA, but it revised its outlook to Negative in November.
Investors returned to the bond market in 2023.
Fixed income fund/ETF flows were positive by $159 billion, reversing the record outflow of $345 billion in 2022. Despite interest rate
volatility, fixed-income returns were positive within the period. Longer-maturity securities performed better relative to intermediate
and shorter maturities in each fixed-income subsectors. Lower credit quality, fixed-income subsectors generated excess returns. The market
anticipated the Federal Reserve easing monetary policy and the U.S. economy avoiding a recession.
The benchmark Bloomberg U.S. Treasury Index returned
4.05% in 2023. High yield corporates and emerging market debt generated returns of 13.44% and 13.10%, respectively. Taxable Municipal
Bonds generated returns of 8.85% compared with Investment Grade Corporate (+8.52%) and Mortgage Backed Securities (+5.05%).
Total mortgage securities guaranteed by Fannie
Mae and Freddie Mac represented 58% of the Fund as of December 31, 2023. Within the mortgage allocation, Fannie Mae and Freddie Mac guaranteed
Mortgage pools (MBS) accounted for 39%, Collateralized Mortgage Obligations (CMOs) accounted for 12%, and Commercial Mortgage Backed Securities
(CMBs) accounted for 7%. U.S. Treasury Securities accounted for 16%, Investment Grade Corporate Bonds accounted for 8%, Taxable Municipals
accounted for 7%, U.S. Government Agency Securities accounted for 7%, and cash accounted for 4%.
The Fund’s allocation decisions reflected the dynamic domestic economic data released in 2023. During the first quarter, the Fund
increased the allocation to investment grade corporate bonds. The spreads relative to U.S. treasuries widened during the regional banking
crisis in the first quarter. However, overall corporate earnings remained positive, the U.S. consumer continued to spend, and inflation
trends improved. The Fund ended the year with 8% of overall value invested in investment grade corporate bonds. In order to fund the purchases,
Taxable Municipal bonds were sold. For 2023, the investment grade corporate bonds returned 8.0%, with 4.5% coming in the final month of
the year. The Fund’s taxable municipal bond holdings reported a total return of 7.6% for the year.
Given the overall trends in the
commercial real estate space, the Fund reduced its CMBs position during the year. Following the regional banking crisis, there was an
increased focus on commercial real estate values and the expected impact of work‐from‐home policies. The Fund began the year
with 24% of the overall assets invested in this fixed income category, and closed the year at 7%. The proceeds of the sales were used
to increase the U.S. Treasury holdings.
The WesMark Government Bond Fund had a total return
of 2.6% the year. The Lipper General US Government Bond Fund average return was 3.38% and the Barclay’s US Government Credit Bond
Index return was 5.72%.
The duration of the securities within the fund
was 5.96 years on December 31, 2023. This compared to 5.91 years as of December 31, 2022. The duration of the Barclays US Government Credit
Bond Index was 6.44 years at the end of the report period.
The credit quality of the fund at the end of the
report period was 89% AA, 4% A, and 7% BBB. The credit quality of the Barclay’s US Government Credit Bond Index was 2% AAA, 62%
AA, 16% A, 18% BBB, and 2% BB.
| Annual Report | December 31, 2023 | |
11 |
Management’s Discussion of Fund Performance
| WesMark Government Bond Fund | December 31, 2023 (Unaudited) |
TOP 10 BOND HOLDINGS
| % of Total | |||
| Name | Rate | Maturity | Net Assets |
| Freddie Mac Pool FR SD8299 | 5.000% | DUE 2/1/2053 | 2.6% |
| Fannie Mae Pool FN MA4918 | 5.000% | DUE 2/1/2053 | 2.6% |
| Freddie Mac Pool FR SD8288 | 5.000% | DUE 1/1/2053 | 2.6% |
| Freddie Mac Pool FR SD8257 | 4.500% | DUE 10/1/2052 | 2.5% |
| Fannie Mae Pool FN MA4656 | 4.500% | DUE 7/1/2052 | 2.4% |
| Fannie Mae Pool FN MA4801 | 4.500% | DUE 11/1/2042 | 2.4% |
| Fannie Mae Pool FN MA4780 | 4.500% | DUE 10/1/2042 | 2.4% |
| Freddie Mac Pool FR SD8222 | 4.000% | DUE 6/1/2052 | 2.4% |
| Fannie Mae Pool FN MA4626 | 4.000% | DUE 6/1/2052 | 2.4% |
| Freddie Mac Pool FR SD8363 | 6.000% | DUE 9/1/2053 | 2.1% |
| Total Net Assets | 24.4% |
Also see Glossary of Terms on page 77.
Performance data quoted represents past performance which is
no guarantee of future results.
An investment in the Fund involves risk,
including loss of principal. Investment in the Fund is subject to investment risks, including, without limitation, market risk, credit
risk, interest rate risk, risks related to ETF net asset value and market price, foreign securities risk, commodity risk, manager risks,
risks of investing in real estate investment trust (REITs), and risks related to company size.
The views in this report were those of the
Fund Managers as of the letter’s publication date and may not reflect his views on the date this letter is first distributed or
anytime thereafter. These views are intended to assist readers in understanding the Fund’s investment methodology and do not constitute
investment advice.
Lipper, Inc., a Reuters company, is a nationally
recognized organization that ranks the performance of mutual funds within a universe of funds that have similar investment objectives.
Rankings are historical and are based on total return with capital gains and dividends reinvested. For the 10-, 5-, 3-, and 1-year periods,
the Government Bond Fund was ranked 51 out of 55, 66 out of 67, 66 out of 67, and 61 out of 73 as of 12/31/2023 in the U.S. Government
Bond Funds category. Lipper does not guarantee the accuracy of this information. Lipper rankings are not intended to predict future results.
| 12 | |
www.wesmarkfunds.com |
Management’s Discussion of Fund Performance
| December 31, 2023 (Unaudited) | WesMark Government Bond Fund |
GROWTH of $10, 000 invested in WesMark Government Bond Fund
The graph below illustrates the hypothetical investment
of $10,000* in the WesMark Government Bond Fund (the “Fund”) from December 31, 2013 to December 31, 2023, compared to the
Barclays Capital Intermediate U.S. Government/Credit Index (“BCIGCI”)**, the Lipper Intermediate U.S. Government Funds Average
(“LIGFA”)***, and the Lipper General U.S. Government Funds Average (“LGUSFA”).****
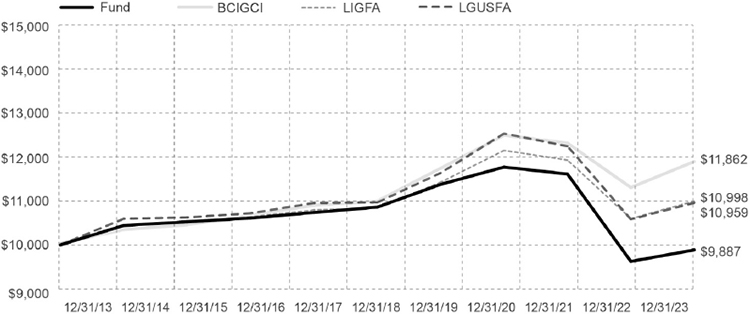
AVERAGE ANNUAL TOTAL RETURN for the periods ended December 31, 2023
| 1 Year | 5 Years | 10 Years |
| 2.71% | -1.86% | -0.11% |
Total Annual Fund Operating Expense (as of most current Prospectus):
1.01%
Performance data quoted represents past
performance which is no guarantee of future results. Investment return and principal value will fluctuate so that an investor’s
shares, when redeemed, may be worth more or less than their original cost. Mutual fund performance changes over time and current performance
may be lower or higher than what is stated. For current to the most recent month end performance and after-tax returns call 1-800-864-1013.
Returns shown do not reflect the deduction of taxes that a shareholder would pay on Fund distributions or the redemption of Fund shares.
Mutual funds are not obligations of or guaranteed by any bank and are not federally insured.
Bond prices are sensitive to changes in interest
rates and a rise in interest rates can cause a decline in their prices. The value of some mortgage-backed securities may be particularly
sensitive to changes in prevailing interest rates, and although the securities are generally supported by some form of government or private
insurance, there is no assurance that private guarantors or insurers will meet their obligations.
| * | Represents a hypothetical investment of $10,000 in the Fund. The Fund’s performance assumes the reinvestment of all dividends and distributions. The BCIGCI, LIGFA and the LGUSFA have been adjusted to reflect reinvestment of dividends on securities in the index and averages. |
| ** | The BCIGCI is an unmanaged market value weighted performance index for government and corporate fixed rate debt issues with maturities between one and ten years. The BCIGCI is not adjusted to reflect sales charges, expenses or other fees that the SEC requires to be reflected in the Fund’s performance. The index is unmanaged and unlike the Fund, is not affected by cash flows. It is not possible to invest directly in an index. |
| *** | The information presented for the LIGFA is the average of the total returns of funds designated by Lipper as falling into the category of funds that invest primarily in securities issued or guaranteed by the U.S. government, its agencies, or its instrumentalities, with dollar-weighted average maturities of five to ten years. Lipper averages do not reflect sales charges. It is not possible to invest directly in an average. |
| **** | The information presented for the LGUSFA is the average total returns of funds designated by Lipper as falling into the category of funds that invest primarily in U.S. government and agency issues. Lipper averages do not reflect sales charges. It is not possible to invest directly in an average. |
| Annual Report | December 31, 2023 | |
13 |
Management’s Discussion of Fund Performance
| WesMark West Virginia Municipal Bond Fund | December 31, 2023 (Unaudited) |
Despite the resilient US economy, favorable inflation
backdrop, and the Federal Reserve pivoting toward a more dovish stance, the US Treasury interest rate curve remained inverted. The interest
rate differential between the 2 year US Treasury and the 10 year US Treasury started the period at -55 basis points. The inversion of
the US Treasury Yield curve deepened to -107 basis points in March 2023 amid regional banking concerns. This was the deepest inversion
of the US Treasury yield curve since 1980. It then ended the year at -37 basis points.
Last year was characterized by interest rate volatility.
At the beginning of the period, the yield on the 10 year US Treasury was 3.88%. The yield declined 57 basis points to 3.31% in April with
the collapse of Silicon Valley Bank and Signature Bank. Given the significant amount of US Treasury issuance, waning foreign demand, and
the Federal Reserve’s declining balance sheet, the yield on the 10 year US Treasury increased 168 basis points. It peaked mid-October
at 4.99%, the highest level since 2007.
The elevated interest rate environment was short-lived.
The yield on the 10 year US Treasury declined 111 basis points to end the period at 3.88%, the same yield at which it began the year.
The year-end rally was a result of improving inflation data.
The US Treasury also decided to shift its debt
issuance in its quarterly refunding. This would go toward US Treasury bills rather than longer-dated US Treasury bonds. These caused anxiety
in the US Treasury auction market.
With on-going, elevated fiscal deficits, Fitch
Rating Agency lowered its credit rating on the US government debt to AA+ in August. This change was over deficit and governance concerns.
Moody’s maintained the US rating at AAA, but it revised its outlook to Negative in November.
Volatility in the tax-exempt municipal market followed a similarly
volatile US Treasury market.
The 10-year AAA-rated municipal began the period
yielding 2.64%. With the concerns in the Financial sector, the yield on the 10-year AAA-rated municipal reached a low of 2.08% in April
2023. It then rose 159 basis points to peak at 3.65% in late October. The tax-exempt municipal market followed suit with a rally in the
US Treasury Market going into year end. The 10-year AAA-rated tax-exempt municipal ended the period at 2.27%.
Lower credit quality municipals outperformed intermediate
and shorter maturities. Lower credit quality municipals generated excess returns. Markets anticipated the Federal Reserve easing monetary
policy and the US economy avoiding a recession. For 2023, the Bloomberg Municipal Bond Index returned 6.40%, AAA-rated municipal bonds
returned 5.80%, and BBB-rated securities returned 8.93%.
Following the sharp rise in rates, the overall issuance was modest during the year. However, the Fund was able to be 100% invested in
West Virginia municipal securities. During the year the small holdings in Ohio and Pennsylvania municipal securities were sold, or matured.
The duration of the fund was 4.02 years as of
December 31, 2023. The net investment income (excluding capital gain distributions) was $0.20 per share for the period, compared to $0.18
for the prior period. Approximately 97.5% of the dividend was derived from West Virginia Municipal securities. It is exempt from Federal
and State income tax for West Virginia residents. At the end of the period, 84% of the securities within the fund were A-rated or better
with 10% being AAA-rated.
The WesMark West Virginia Municipal Bond Fund
had a total return of 4.27% in 2023. The Lipper Other States Municipal Debt Fund return was 5.38%. The Bloomberg Barclay’s Municipal
5-year Index return was 4.31%. The funds higher credit quality and shorter maturity structure limited its performance in the period relative
to its benchmark.
| 14 | |
www.wesmarkfunds.com |
Management’s Discussion of Fund
Performance
| December 31, 2023 (Unaudited) | WesMark West Virginia Municipal Bond Fund |
TOP 10 BOND HOLDINGS
| % of Total | |
| Name | Net Assets |
| Ohio County Board of Education | 3.3% |
| West Virginia Water Development Authority Infrastructure Revenue Bonds (West Virginia Infrastructure Jobs Program) | 3.1% |
| Jefferson County Board of Education | 2.8% |
| Hancock, WV | 2.5% |
| Monongalia County Building Commission | 2.3% |
| West Virginia Higher Education Policy Commission Revenue Bonds (Higher Education Facilities) | 2.1% |
| Mason County Public Service District Water Revenue | 2.0% |
| Cabell County Board of Education | 2.0% |
| Hampshire County, West Virginia, Building Commission Revenue Bonds | 1.9% |
| West Virginia Economic Development Authority Lease Revenue Bonds (State Office Building & Parking Lot) | 1.8% |
| Total Net Assets | 23.8% |
Also see Glossary of Terms on page 77.
Performance data quoted represents past performance which is
no guarantee of future results.
An investment in the Fund involves risk,
including loss of principal. Investment in the Fund is subject to investment risks, including, without limitation, market risk, credit
risk, interest rate risk, risks related to ETF net asset value and market price, foreign securities risk, commodity risk, manager risks,
risks of investing in real estate investment trust (REITs), and risks related to company size.
The views in this report were those of the
Fund Managers as of the letter’s publication date and may not reflect his views on the date this letter is first distributed or
anytime thereafter. These views are intended to assist readers in understanding the Fund’s investment methodology and do not constitute
investment advice.
Lipper, Inc., a Reuters company, is a nationally
recognized organization that ranks the performance of mutual funds within a universe of funds that have similar investment objectives.
Rankings are historical and are based on total return with capital gains and dividends reinvested. For the 10-, 5-, 3-, and 1-year periods,
the West Virginia Municipal Bond Fund was ranked 129 out of 150, 164 out of 212, 107 out of 213, and 180 out of 215 as of 12/31/2023 in
the Other States Municipal Debt Funds category. Lipper does not guarantee the accuracy of this information. Lipper rankings are not intended
to predict future results.
| Annual Report | December 31, 2023 | |
15 |
Management’s Discussion of Fund Performance
| WesMark West Virginia Municipal Bond Fund | December 31, 2023 (Unaudited) |
GROWTH of $10,000 invested in WesMark West Virginia Municipal Bond
Fund
The graph below illustrates the hypothetical investment
of $10,000* in the WesMark West Virginia Municipal Bond Fund (the “Fund”) from December 31, 2013 to December 31, 2023, compared
to the Bloomberg Barclays Capital Municipal Bond 5 Year Total Return Index (“BCM5I”)**, the Lipper Intermediate Municipal
Debt Funds Average (“LIMDFA”)*** and the Lipper Other States Muni Debt Fund Average (“LOSMFA”).****
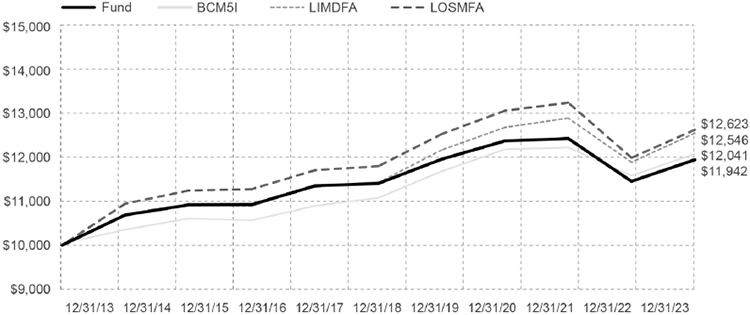
AVERAGE ANNUAL TOTAL RETURN for the periods ended December 31, 2023
| 1 Year | 5 Years | 10 Years |
| 4.29% | 0.93% | 1.79% |
Total Annual Fund Operating Expense (as of most current Prospectus):
1.10%
Performance data quoted represents past
performance which is no guarantee of future results. Investment return and principal value will fluctuate so that an investor’s
shares, when redeemed, may be worth more or less than their original cost. Mutual fund performance changes over time and current performance
may be lower or higher than what is stated. For current to the most recent month end performance and after-tax returns call 1-800-864-1013.
Returns shown do not reflect the deduction of taxes that a shareholder would pay on Fund distributions or the redemption of Fund shares.
Mutual funds are not obligations of or guaranteed by any bank and are not federally insured.
Bond prices are sensitive to changes in interest rates and a rise
in interest rates can cause a decline in their prices.
| * | Represents a hypothetical investment of $10,000 in the Fund. The Fund’s performance assumes the reinvestment of all dividends and distributions. The BCM5I, LOSMFA and the LIMDFA have been adjusted to reflect reinvestment of dividends on securities in the index and average. |
| ** | The BCM5I is an unmanaged market value weighted performance index for major municipal bonds of all quality ratings with an average maturity of approximately five years. BCM5I is not adjusted to reflect sales charges, expenses, or other fees that the SEC requires to be reflected in the Fund’s performance. The index is unmanaged and unlike the Fund, is not affected by cash flows. It is not possible to invest directly in an index. |
| *** | The LIMDFA is an unmanaged index of funds that invest in municipal debt issues with dollar-weighted average maturities of five to ten years. These figures do not reflect sales charges. It is not possible to invest directly in an average. |
| **** | The LOSMFA is an unmanaged index of funds that limit assets to those securities exempt from taxation in a specified state or city. These figures do not reflect sales charges. It is not possible to invest directly in an average. |
| 16 | |
www.wesmarkfunds.com |
Management’s Discussion of Fund Performance
| December 31, 2023 (Unaudited) | WesMark Tactical Opportunity Fund |
The WesMark Tactical Opportunity Fund (“the
Fund”) began 2023 with an allocation to equity markets of 48.9%, above the fixed-income allocation of 41.7%.
The decision was primarily based on the view that
equity markets would recover from the downturn experienced in 2022. The S&P 500 Index and the MSCI All-World Index were both down
over 18% in 2022, leaving the S&P 500 forward price to earnings below the long-term average at 17.3x.
The Federal Reserve increased the Fed Funds Rate
target more quickly than the consensus expectation, leading to increased financial markets volatility throughout the year. However, economic
indicators continued to improve, economic growth outpaced expectations, inflation decelerated, and labor market readings remained near
historic lows. Nevertheless, 2023 proved to be a year of positive performance for equity and fixed income markets.
In the first half of 2023, equities began to rebound
as interest rates began to rise. This led to a shift in allocation from equities to fixed income. Ending the first quarter, the fixed-income
allocation had increased to 47.1%; the equity allocation decreased to 43.9%. Fixed-income exposure was largely concentrated in the short-end
of the yield curve, where rates had increased the most dramatically and provided attractive yields.
The equity allocation in the first half was more
growth oriented than the second half. It took advantage of the recovery, as the S&P 500 Index was up more than 16% by June. The allocation
to alternatives increased, starting the year at 5.3% and finishing the first half at 7.5%. This was an effort to take advantage of depressed
energy prices and the inflation-hedging properties of commodities.
The second half of 2023 exhibited more volatility across equities and
fixed income.
The 10-year Treasury yield began the second half
at 3.83%, relatively unchanged on the year, then rallied to over 5% in October. It eventually settling unchanged at 3.88% by the end of
2023. Over the same time frame, the S&P 500 contracted 7.5% from the end of the second quarter to October lows, then rallied 15.9%
to finish the year. The Fund finished the third quarter with an allocation of 46.3% to fixed income, 40.5% to equities, and 7.4% to alternatives
to reduce risk as volatility increased.
As we finished 2023, the Fund had an increased
exposure to alternatives at 8.7%, a lower fixed-income allocation at 42.2%, and a higher equity allocation at 42.8%. The duration within
the fixed-income exposure was extended as long-term rates appeared to peak with inflation continuing to trend lower. For most of the year,
a concentrated group of growth-focused equities accounted for most S&P 500 Index returns. The rally from October lows was led by a
broader stock performance. As a result, we shifted our equity exposure to more value-focused holdings in November and December.
For the year, the Fund posted a total return of 7.1% compared to the
Lipper Flexible Funds category return of 11.8%.
On a trailing five-year basis, the Fund reported
an annualized return of 6.2% compared to the Lipper Flexible Funds category annualized return of 6.7%.
Since the Fund’s inception, March 1, 2017,
the WesMark Tactical Opportunity Fund has posted an annualized total return of 5.0%, compared to the MSCI All-World Index return of 9.9%
and the U.S. Bloomberg Aggregate Bond Index return of 1.2% for the same period.
The exposure to large-cap growth in the Fund through
the SPDR S&P 500 ETF and increased allocation to the Russell 2000 through the iShares Russell 2000 ETF both accounted for nearly half
of the returns in the year, up 26.0% and 18.2%, respectively.
Additionally, the increased alternatives allocation
by purchasing the SPDR Gold Shares ETF was incremental to performance as the fund increased 12.3% on the year.
Leading to the underperformance, the allocation
to the Invesco Optimum Yield Diversified Commodity Strategy and the SPDR Energy Select Fund ETF was a drag on performance for the Fund.
WTI Crude finished 2023 down 10.7% and natural gas was down 43.8%.
The top 10 holdings accounted for 81.4% of the overall market value
of the Fund.
During 2023, the Fund made limited use of derivatives, such as options. As a result, derivatives had no material impact on the Fund’s
performance.
| Annual Report | December 31, 2023 | |
17 |
Management’s Discussion of Fund Performance
| WesMark Tactical Opportunity Fund | December 31, 2023 (Unaudited) |
TOP 10 EQUITY HOLDINGS
| Security Name | % of Total Net Assets |
| iShares iBoxx $ Investment Grade Corporate Bond ETF | 14.6% |
| iShares® Core U.S. Aggregate Bond ETF | 14.2% |
| Vanguard Mega Cap Value ETF | 10.3% |
| SPDR S&P 500 ETF Trust | 9.9% |
| iShares 1-3 Year Treasury Bond ETF | 8.6% |
| iShares Russell 2000 ETF | 7.1% |
| SPDR Gold Shares | 5.3% |
| iShares iBoxx $ High Yield Corporate Bond ETF | 4.8% |
| Invesco Optimum Yield Diversified Commodity Strategy No K-1 ETF | 3.4% |
| iShares MSCI ACWI ex U.S. ETF | 3.2% |
| Total Net Assets | 81.4% |
Also see Glossary of Terms on page 77.
Performance data quoted represents past performance which is
no guarantee of future results.
Diversification does not eliminate the risk of experiencing investment
losses.
An investment in the Fund involves risk,
including loss of principal. Investment in the Fund is subject to investment risks, including, without limitation, market risk, credit
risk, interest rate risk, risks related to ETF net asset value and market price, foreign securities risk, commodity risk, manager risks,
risks of investing in real estate investment trust (REITs), and risks related to company size.
The views in this report were those of the
Fund Managers as of the letter’s publication date and may not reflect his views on the date this letter is first distributed or
anytime thereafter. These views are intended to assist readers in understanding the Fund’s investment methodology and do not constitute
investment advice.
Lipper, Inc., a Reuters company, is a nationally
recognized organization that ranks the performance of mutual funds within a universe of funds that have similar investment objectives.
Rankings are historical and are based on total return with capital gains and dividends reinvested. For the 5-, 3-, and 1-year periods,
the Tactical Opportunity Fund was ranked 194 out of 378, 228 out of 416, and 359 out of 452 as of 12/31/2023 in the Flexible Portfolio
Funds category. Lipper does not guarantee the accuracy of this information. Lipper rankings are not intended to predict future results.
| 18 | |
www.wesmarkfunds.com |
Management’s Discussion of Fund Performance
| December 31, 2023 (Unaudited) | WesMark Tactical Opportunity Fund |
GROWTH of $10,000 invested in WesMark Tactical Opportunity Fund
The graph below illustrates the hypothetical investment
of $10,000* in the WesMark Tactical Opportunity Fund (the “Fund”) from March 1, 2017 to December 31, 2023, compared to the
Tactical Composite Index (“Composite”)**, The Hedge Fund Research, Inc. (HFRI) Fund of Funds Composite Index ***, and the
Lipper Flexible Portfolio Funds****
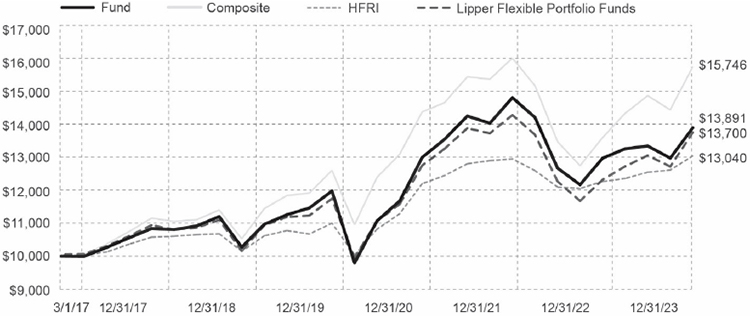
AVERAGE ANNUAL TOTAL RETURN for the periods ended December 31, 2023
| Since Inception | ||
| 1 Year | 5 Year | (3/1/17) |
| 7.10% | 6.23% | 4.93% |
Total Annual Fund Operating Expense (as of most current Prospectus):
1.61%
Performance data quoted represents past
performance which is no guarantee of future results. Investment return and principal value will fluctuate so that an investor’s
shares, when redeemed, may be worth more or less than their original cost. Mutual fund performance changes over time and current performance
may be lower or higher than what is stated. For current to the most recent month end performance and after-tax returns call 1-800-864-1013.
Returns shown do not reflect the deduction of taxes that a shareholder would pay on Fund distributions or the redemption of Fund shares.
Mutual funds are not obligations of or guaranteed by any bank and are not federally insured.
| * | Represents a hypothetical investment of $10,000 in the Fund. The Fund’s performance assumes the reinvestment of all dividends and distributions. The Composite, the MSCI ACWI and the US BarCap Agg have been adjusted to reflect reinvestment of dividends on securities in the index and average. |
| ** | Composite is comprised of a combination of 60% of MSCI All World Index (“ACWI”) 30% Bloomberg Barclays US Aggregate Index and 10% of HFRI Fund of Funds Index. The Tactical Composite Index is not adjusted to reflect sales charges, expenses, or other fees that the SEC requires to be reflected in the Fund’s performance. The index is unmanaged and unlike the Fund, is not affected by cash flows. It is not possible to invest directly in an index. |
| *** | HFRI of Funds Composite Index is an equal weighted index that consists of over 800 constituent hedge funds, including both domestic and offshore funds. The HFRI is not adjusted to reflect sales charges, expenses, or other fees that the SEC requires to be reflected in the Fund’s performance. The index is unmanaged and unlike the Fund, is not affected by cash flows. It is not possible to invest directly in an index. |
| **** | The Lipper Flexible Portfolio Funds is an unmanaged index of funds that allocate their investments to both domestic and foreign securities across traditional asset classes with a focus on total return. The traditional asset classes utilized are common stocks, bonds, and money market instruments. Lipper Flexible Portfolio Funds is not adjusted to reflect sales charges, expenses, or other fees that the SEC requires to be reflected in the Fund’s performance. The index is unmanaged and unlike the Fund, is not affected by cash flows. It is not possible to invest directly in an index. |
| Annual Report | December 31, 2023 | |
19 |
Portfolio of Investments Summary Table
| WesMark Small Company Fund | December 31, 2023 (Unaudited) |
As of December 31, 2023, the Fund’s Portfolio Composition(1)
was as follows:
| Percentage of | |
| Portfolio Composition | Total Net Assets |
| COMMON STOCKS | 97.3% |
| EXCHANGE TRADED FUNDS (ETF) | 2.0% |
| SHORT TERM INVESTMENTS(2) | 1.2% |
| OTHER ASSETS AND LIABILITIES – NET(3) | -0.5% |
| TOTAL NET ASSETS | 100.0% |
As of December 31, 2023, the Fund’s Sector composition(4)
was as follows:
| Percentage of | |
| Sector Composition | Total Net Assets |
| Industrials | 23.5% |
| Financials | 17.4% |
| Information Technology | 16.2% |
| Health Care | 10.7% |
| Energy | 6.4% |
| Consumer, Cyclical | 3.9% |
| Consumer Staples | 3.5% |
| Materials | 3.1% |
| Consumer Discretionary | 2.8% |
| Exchange Traded Funds | 2.0% |
| Consumer, Non-cyclical | 1.8% |
| Technology | 1.7% |
| Communications | 1.4% |
| Utilities | 1.4% |
| Consumer Cyclical | 1.3% |
| Consumer Non-Cyclical | 1.2% |
| Communication Services | 0.8% |
| Real Estate | 0.2% |
| Equity Portfolio Sub-Total | 99.3% |
| Short Term Investments(2) | 1.2% |
| Other Assets and Liabilities – Net(3) | -0.5% |
| Total Net Assets | 100.0% |
| (1) | See the Fund’s Prospectus and Statement of Additional Information for a description of the types of securities in which the Fund invests. |
| (2) | Short Term Investments include investment in a money market mutual fund. |
| (3) | Assets, other than investments in securities, less liabilities. |
| (4) | Securities are assigned to a sector classification by the Fund’s advisor. |
| 20 | |
www.wesmarkfunds.com |
Portfolio of Investments
| December 31, 2023 | WesMark Small Company Fund |
| Shares | Value | |||||||
| COMMON STOCKS-97.3% | ||||||||
| COMMUNICATION SERVICES-0.8% | ||||||||
| Telecommunications-0.8% | ||||||||
| 51,472 | Extreme Networks, Inc.(1) | $ | 907,966 | |||||
| TOTAL COMMUNICATION SERVICES | 907,966 | |||||||
| COMMUNICATIONS-1.4% | ||||||||
| Internet-1.4% | ||||||||
| 82,500 | Eventbrite, Inc.(1) | 689,700 | ||||||
| 12,746 | Ziff Davis, Inc.(1) | 856,404 | ||||||
| 1,546,104 | ||||||||
| TOTAL COMMUNICATIONS | 1,546,104 | |||||||
| CONSUMER CYCLICAL-1.3% | ||||||||
| Retail-1.3% | ||||||||
| 50,181 | Bloomin’ Brands, Inc. | 1,412,595 | ||||||
| TOTAL CONSUMER CYCLICAL | 1,412,595 | |||||||
| CONSUMER, CYCLICAL-3.9% | ||||||||
| Apparel-0.6% | ||||||||
| 6,535 | Oxford Industries, Inc. | 653,500 | ||||||
| Lodging-0.9% | ||||||||
| 25,093 | Hilton Grand Vacations, Inc.(1) | 1,008,237 | ||||||
| Retail-2.4% | ||||||||
| 32,785 | Dutch Bros, Inc., Class A(1) | 1,038,301 | ||||||
| 41,832 | Wendy’s Co. | 814,887 | ||||||
| 3,411 | Wingstop, Inc. | 875,194 | ||||||
| 2,728,382 | ||||||||
| TOTAL CONSUMER, CYCLICAL | 4,390,119 | |||||||
| CONSUMER DISCRETIONARY-2.8% | ||||||||
| Automotive Retail-1.9% | ||||||||
| 10,222 | Advance Auto Parts, Inc. | 623,849 | ||||||
| 4,298 | Lithia Motors, Inc., Class A | 1,415,245 | ||||||
| 2,039,094 | ||||||||
| Retail-0.9% | ||||||||
| 48,699 | First Watch Restaurant Group, Inc.(1) | 978,850 | ||||||
| TOTAL CONSUMER DISCRETIONARY | 3,017,944 | |||||||
| Shares | Value | |||||||
| CONSUMER NON-CYCLICAL-1.2% | ||||||||
| Cosmetics/Personal Care-1.2% | ||||||||
| 8,824 | elf Beauty, Inc.(1) | $ | 1,273,656 | |||||
| TOTAL CONSUMER NON-CYCLICAL | 1,273,656 | |||||||
| CONSUMER STAPLES-3.5% | ||||||||
| Agriculture-0.9% | ||||||||
| 17,479 | Andersons, Inc. | 1,005,742 | ||||||
| Food Retail-1.5% | ||||||||
| 35,238 | Sprouts Farmers Market, Inc.(1) | 1,695,300 | ||||||
| Packaged Foods & Meats-1.1% | ||||||||
| 31,446 | Simply Good Foods Co.(1) | 1,245,262 | ||||||
| TOTAL CONSUMER STAPLES | 3,946,304 | |||||||
| CONSUMER, NON-CYCLICAL-1.8% | ||||||||
| Beverages-0.5% | ||||||||
| 154,000 | BRC, Inc.(1) | 559,020 | ||||||
| Commercial Services-0.9% | ||||||||
| 42,656 | Hackett Group, Inc. | 971,277 | ||||||
| Healthcare-Products-0.4% | ||||||||
| 6,200 | Azenta, Inc.(1) | 403,868 | ||||||
| TOTAL CONSUMER, NON-CYCLICAL | 1,934,165 | |||||||
| ENERGY-6.4% | ||||||||
| Oil & Gas Equipment & Services-1.1% | ||||||||
| 42,571 | ChampionX Corp. | 1,243,499 | ||||||
| Oil & Gas Exploration & Production-0.3% | ||||||||
| 2,400 | Gulfport Energy Corp.(1) | 319,680 | ||||||
| Oil&Gas-5.0% | ||||||||
| 14,678 | Civitas Resources, Inc. | 1,003,682 | ||||||
| 149,549 | Comstock Resources, Inc. | 1,323,509 | ||||||
| 56,538 | Magnolia Oil & Gas Corp., Class A | 1,203,694 | ||||||
| 20,494 | Matador Resources Co. | 1,165,289 | ||||||
| 27,934 | SilverBow Resources, Inc.(1) | 812,321 | ||||||
| 5,508,495 | ||||||||
| TOTAL ENERGY | 7,071,674 | |||||||
| Annual Report | December 31, 2023 | |
21 |
Portfolio of Investments
| WesMark Small Company Fund | December 31, 2023 |
| Shares | Value | |||||||
| FINANCIALS-17.4% | ||||||||
| Asset Management & Custody Banks-0.9% | ||||||||
| 28,962 | Victory Capital Holdings, Inc., Class A | $ | 997,451 | |||||
| Diversified Financial Services-1.1% | ||||||||
| 11,704 | PJT Partners, Inc. | 1,192,287 | ||||||
| Insurance-1.2% | ||||||||
| 15,200 | Employers Holdings, Inc. | 598,880 | ||||||
| 14,009 | Jackson Financial, Inc., Class A | 717,261 | ||||||
| 1,316,141 | ||||||||
| Investment Banking & Brokerage-3.7% | ||||||||
| 58,128 | Stifel Financial Corp. | 4,019,551 | ||||||
| Regional Banks-9.5% | ||||||||
| 27,827 | Ameris Bancorp | 1,476,222 | ||||||
| 45,665 | Atlantic Union Bankshares Corp. | 1,668,599 | ||||||
| 32,613 | BankUnited, Inc. | 1,057,640 | ||||||
| 22,169 | Banner Corp. | 1,187,372 | ||||||
| 46,816 | Cadence Bank | 1,385,285 | ||||||
| 10,402 | Community Bank System, Inc. | 542,048 | ||||||
| 60,108 | First Bancorp/Southern Pines, NC | 2,224,597 | ||||||
| 52,504 | Old National Bancorp | 886,793 | ||||||
| 10,428,556 | ||||||||
| REITS-1.0% | ||||||||
| 9,400 | National Storage Affiliates Trust | 389,818 | ||||||
| 46,985 | Sabra Health Care REIT, Inc. | 670,476 | ||||||
| 1,060,294 | ||||||||
| TOTAL FINANCIALS | 19,014,280 | |||||||
| HEALTH CARE-10.7% | ||||||||
| Commercial Services-1.0% | ||||||||
| 28,169 | Progyny, Inc.(1) | 1,047,323 | ||||||
| Health Care Distributors-1.0% | ||||||||
| 38,036 | Patterson Cos., Inc. | 1,082,124 | ||||||
| Health Care Equipment-0.5% | ||||||||
| 15,525 | AtriCure, Inc.(1) | 554,087 | ||||||
| Health Care Supplies-1.1% | ||||||||
| 59,696 | Neogen Corp.(1) | 1,200,487 | ||||||
| Healthcare-Products-1.5% | ||||||||
| 16,318 | Integer Holdings Corp.(1) | 1,616,787 | ||||||
| Shares | Value | |||||||
| Healthcare-Services-2.3% | ||||||||
| 78,507 | Enhabit, Inc.(1) | $ | 812,547 | |||||
| 37,733 | Select Medical Holdings Corp. | 886,726 | ||||||
| 25,663 | Surgery Partners, Inc.(1) | 820,959 | ||||||
| 2,520,232 | ||||||||
| Pharmaceuticals-3.3% | ||||||||
| 23,152 | Corcept Therapeutics, Inc.(1) | 751,977 | ||||||
| 149,706 | Elanco Animal Health, Inc.(1) | 2,230,619 | ||||||
| 11,109 | Prestige Brands Holdings, Inc.(1) | 680,093 | ||||||
| 3,662,689 | ||||||||
| TOTAL HEALTH CARE | 11,683,729 | |||||||
| INDUSTRIALS-23.5% | ||||||||
| Aerospace & Defense-4.7% | ||||||||
| 81,828 | AerSale Corp.(1) | 1,038,806 | ||||||
| 27,761 | Moog, Inc., Class A | 4,019,238 | ||||||
| 5,058,044 | ||||||||
| Building Materials-2.1% | ||||||||
| 8,797 | Armstrong World Industries, Inc. | 864,921 | ||||||
| 18,028 | Gibraltar Industries, Inc.(1) | 1,423,851 | ||||||
| 2,288,772 | ||||||||
| Building Products-2.2% | ||||||||
| 32,839 | AAON, Inc. | 2,425,817 | ||||||
| Construction & Engineering-5.9% | ||||||||
| 28,922 | Granite Construction, Inc. | 1,470,973 | ||||||
| 23,524 | Quanta Services, Inc. | 5,076,479 | ||||||
| 6,547,452 | ||||||||
| Construction Machinery & Heavy Trucks-0.4% | ||||||||
| 34,146 | Shyft Group, Inc. | 417,264 | ||||||
| Electronics-2.7% | ||||||||
| 29,500 | Atmus Filtration Technologies, Inc.(1) | 692,955 | ||||||
| 44,009 | Celestica, Inc.(1) | 1,288,584 | ||||||
| 64,291 | TTM Technologies, Inc.(1) | 1,016,441 | ||||||
| 2,997,980 | ||||||||
| Industrials-1.8% | ||||||||
| 32,945 | Korn Ferry | 1,955,286 | ||||||
| Machinery-Constr&Mining-1.4% | ||||||||
| 24,874 | Argan, Inc. | 1,163,854 | ||||||
| 23,700 | Bloom Energy Corp., Class A(1) | 350,760 | ||||||
| 1,514,614 | ||||||||
| 22 | |
www.wesmarkfunds.com |
Portfolio of Investments
| December 31, 2023 | WesMark Small Company Fund |
| Shares | Value | |||||||
| Machinery-Diversified-2.3% | ||||||||
| 14,705 | Applied Industrial Technologies, Inc. | $ | 2,539,406 | |||||
| TOTAL INDUSTRIALS | 25,744,635 | |||||||
| INFORMATION TECHNOLOGY-16.2% | ||||||||
| Application Software-1.9% | ||||||||
| 81,254 | Box, Inc., Class A(1) | 2,080,915 | ||||||
| Data Processing & Outsourced Services-1.3% | ||||||||
| 64,947 | I3 Verticals, Inc., Class A(1) | 1,374,928 | ||||||
| Electronic Components-1.0% | ||||||||
| 59,096 | Knowles Corp.(1) | 1,058,409 | ||||||
| Electronic Equipment & Instruments-1.6% | ||||||||
| 13,427 | OSI Systems, Inc.(1) | 1,732,754 | ||||||
| IT Consulting & Other Services-1.4% | ||||||||
| 12,363 | Science Applications International Corp. | 1,536,968 | ||||||
| Software-2.2% | ||||||||
| 186,266 | Olo, Inc.(1) | 1,065,442 | ||||||
| 49,238 | SentinelOne, Inc., Class A(1) | 1,351,091 | ||||||
| 2,416,533 | ||||||||
| Systems Software-5.1% | ||||||||
| 6,656 | Qualys, Inc.(1) | 1,306,440 | ||||||
| 95,161 | Varonis Systems, Inc.(1) | 4,308,890 | ||||||
| 5,615,330 | ||||||||
| Technology Hardware, Storage & Peripherals-1.7% | ||||||||
| 53,383 | Pure Storage, Inc., Class A(1) | 1,903,638 | ||||||
| TOTAL INFORMATION TECHNOLOGY | 17,719,475 | |||||||
| MATERIALS-3.1% | ||||||||
| Chemicals-1.9% | ||||||||
| 18,350 | Hawkins, Inc. | 1,292,207 | ||||||
| 9,000 | HB Fuller Co. | 732,690 | ||||||
| 2,024,897 | ||||||||
| Packaging&Containers-0.6% | ||||||||
| 9,839 | Greif, Inc., Class A | 645,340 | ||||||
| Shares | Value | |||||||
| Steel-0.6% | ||||||||
| 9,682 | Carpenter Technology Corp. | $ | 685,486 | |||||
| TOTAL MATERIALS | 3,355,723 | |||||||
| REAL ESTATE-0.2% | ||||||||
| REITS-0.2% | ||||||||
| 17,997 | Physicians Realty Trust | 239,540 | ||||||
| TOTAL REAL ESTATE | 239,540 | |||||||
| TECHNOLOGY-1.7% | ||||||||
| Software-1.7% | ||||||||
| 8,000 | Alteryx, Inc., Class A(1) | 377,280 | ||||||
| 69,000 | Definitive Healthcare Corp.(1) | 685,860 | ||||||
| 18,600 | Oddity Tech, Ltd.(1) | 865,458 | ||||||
| 1,928,598 | ||||||||
| TOTAL TECHNOLOGY | 1,928,598 | |||||||
| UTILITIES-1.4% | ||||||||
| Electric-1.4% | ||||||||
| 21,600 | Avista Corp. | 771,984 | ||||||
| 8,547 | Otter Tail Corp. | 726,239 | ||||||
| 1,498,223 | ||||||||
| TOTAL UTILITIES | 1,498,223 | |||||||
| TOTAL COMMON STOCKS | ||||||||
| (Cost $67,589,135) | 106,684,730 | |||||||
| EXCHANGE TRADED FUNDS-2.0% | ||||||||
| 20,476 | iShares® Core S&P Small-Cap® ETF | 2,216,527 | ||||||
| TOTAL EXCHANGE TRADED FUNDS | ||||||||
| (Cost $1,942,308) | 2,216,527 | |||||||
| SHORT TERM INVESTMENTS-1.2% | ||||||||
| Mutual Funds-1.2% | ||||||||
| 1,269,915 | Federated Hermes Government Obligations Fund, Premier Class, 7-Day Yield 5.279% (at net asset value) | 1,269,915 | ||||||
| TOTAL SHORT TERM INVESTMENTS | ||||||||
| (Cost $1,269,915) | 1,269,915 | |||||||
| Annual Report | December 31, 2023 | |
23 |
Portfolio of Investments
| WesMark Small Company Fund | December 31, 2023 |
| Shares | Value | |||
| TOTAL INVESTMENTS-100.5% | ||||
| (Cost $70,801,358) | $ | 110,171,172 | ||
| OTHER ASSETS AND LIABILITIES-NET(2)-(0.5)% | (515,396 | ) | ||
| NET ASSETS-100.0% | $ | 109,655,776 | ||
| (1) | Non-income producing security. |
| (2) | Assets, other than investments in securities, less liabilities. |
| Note | – | The categories of investments are shown as a percentage of net assets as of December 31, 2023. |
See Notes to Financial Statements which are an integral part of
the Financial Statements.
| 24 | |
www.wesmarkfunds.com |
Portfolio of Investments Summary Table
| December 31, 2023 (Unaudited) | WesMark Large Company Fund |
As of December 31, 2023, the Fund’s Portfolio Composition(1)
was as follows:
| Portfolio Composition |
Percentage of Total Net Assets |
| COMMON STOCKS | 98.2% |
| SHORT TERM INVESTMENTS(2) | 2.6% |
| OTHER ASSETS AND LIABILITIES – NET(3) | -0.8% |
| TOTAL NET ASSETS | 100.0% |
As of December 31, 2023, the Fund’s Sector composition(4)
was as follows:
| Sector Composition |
Percentage of Total Net Assets |
| Information Technology | 36.7% |
| Health Care | 16.0% |
| Industrials | 10.9% |
| Consumer Discretionary | 10.1% |
| Financials | 7.0% |
| Consumer Staples | 5.7% |
| Energy | 4.8% |
| Communications | 2.2% |
| Materials | 1.5% |
| Consumer, Cyclical | 1.4% |
| Consumer, Non-cyclical | 1.0% |
| Utilities | 0.9% |
| Equity Portfolio Sub-Total | 98.2% |
| Short Term Investments(2) | 2.6% |
| Other Assets and Liabilities – Net(3) | -0.8% |
| Total Net Assets | 100.0% |
| (1) | See the Fund’s Prospectus and Statement of Additional Information for a description of the types of securities in which the Fund invests. |
| (2) | Short Term Investments include investment in a money market mutual fund. |
| (3) | Assets, other than investments in securities, less liabilities. |
| (4) | Securities are assigned to a sector classification by the Fund’s advisor. |
| Annual Report | December 31, 2023 | |
25 |
Portfolio of Investments
| WesMark Large Company Fund | December 31, 2023 |
| Shares | Value | |||||||
| COMMON STOCKS-98.2% | ||||||||
| COMMUNICATIONS-2.2% | ||||||||
| Internet-2.2% | ||||||||
| 17,000 | Meta Platforms, Inc., Class A(1) | $ | 6,017,320 | |||||
| 5,326 | Spotify Technology SA(1) | 1,000,809 | ||||||
| 7,018,129 | ||||||||
| TOTAL COMMUNICATIONS | 7,018,129 | |||||||
| CONSUMER, CYCLICAL-1.4% | ||||||||
| Apparel-0.6% | ||||||||
| 67,700 | On Holding AG(1) | 1,825,869 | ||||||
| Retail-0.8% | ||||||||
| 4,617 | Lululemon Athletica, Inc.(1) | 2,360,626 | ||||||
| TOTAL CONSUMER, CYCLICAL | 4,186,495 | |||||||
| CONSUMER DISCRETIONARY-10.1% | ||||||||
| General Merchandise Stores-0.3% | ||||||||
| 7,212 | Target Corp. | 1,027,133 | ||||||
| Home Improvement Retail-2.8% | ||||||||
| 25,500 | Home Depot, Inc. | 8,837,025 | ||||||
| Internet & Direct Marketing Retail-5.6% | ||||||||
| 116,093 | Amazon.com, Inc.(1) | 17,639,170 | ||||||
| Restaurants-1.4% | ||||||||
| 765 | Chipotle Mexican Grill, Inc.(1) | 1,749,524 | ||||||
| 32,820 | Restaurant Brands International, Inc. | 2,564,227 | ||||||
| 4,313,751 | ||||||||
| TOTAL CONSUMER DISCRETIONARY | 31,817,079 | |||||||
| CONSUMER STAPLES-5.7% | ||||||||
| Distillers & Vintners-2.0% | ||||||||
| 26,361 | Constellation Brands, Inc., Class A | 6,372,772 | ||||||
| Food & Staples Retailing-0.5% | ||||||||
| 25,868 | BJ’s Wholesale Club Holdings, Inc.(1) | 1,724,361 | ||||||
| Household Products-2.0% | ||||||||
| 42,664 | Procter & Gamble Co. | 6,251,983 | ||||||
| Shares | Value | |||||||
| Packaged Foods & Meats-1.2% | ||||||||
| 52,742 | Mondelez International, Inc., Class A | $ | 3,820,103 | |||||
| TOTAL CONSUMER STAPLES | 18,169,219 | |||||||
| CONSUMER, NON-CYCLICAL-1.0% | ||||||||
| Beverages-0.5% | ||||||||
| 48,058 | Keurig Dr Pepper, Inc. | 1,601,293 | ||||||
| Commercial Services-0.5% | ||||||||
| 6,747 | Verisk Analytics, Inc. | 1,611,588 | ||||||
| TOTAL CONSUMER, NON-CYCLICAL | 3,212,881 | |||||||
| ENERGY-4.8% | ||||||||
| Oil & Gas Exploration & Production-3.4% | ||||||||
| 42,274 | ConocoPhillips | 4,906,743 | ||||||
| 60,843 | Devon Energy Corp. | 2,756,188 | ||||||
| 19,000 | Diamondback Energy, Inc. | 2,946,520 | ||||||
| 10,609,451 | ||||||||
| Oil, Gas & Consumable Fuels-1.4% | ||||||||
| 42,626 | Exxon Mobil Corp. | 4,261,748 | ||||||
| TOTAL ENERGY | 14,871,199 | |||||||
| FINANCIALS-7.0% | ||||||||
| Asset Management & Custody Banks-1.7% | ||||||||
| 6,669 | BlackRock, Inc. | 5,413,894 | ||||||
| Banks-0.5% | ||||||||
| 49,726 | Bank of America Corp. | 1,674,274 | ||||||
| Diversified Banks-1.8% | ||||||||
| 33,130 | JP Morgan Chase & Co. | 5,635,413 | ||||||
| Investment Banking & Brokerage-2.3% | ||||||||
| 9,747 | The Goldman Sachs Group, Inc. | 3,760,100 | ||||||
| 36,221 | Morgan Stanley | 3,377,608 | ||||||
| 7,137,708 | ||||||||
| Regional Banks-0.7% | ||||||||
| 65,900 | Fifth Third Bancorp | 2,272,891 | ||||||
| TOTAL FINANCIALS | 22,134,180 | |||||||
| 26 | |
www.wesmarkfunds.com |
Portfolio of Investments
| December 31, 2023 | WesMark Large Company Fund |
| Shares | Value | |||||||
| HEALTH CARE-16.0% | ||||||||
| Biotechnology-3.7% | ||||||||
| 29,978 | AbbVie, Inc. | $ | 4,645,692 | |||||
| 23,491 | Amgen, Inc. | 6,765,878 | ||||||
| 11,411,570 | ||||||||
| Health Care Equipment-2.5% | ||||||||
| 71,604 | Abbott Laboratories | 7,881,452 | ||||||
| Life Sciences Tools & Services-3.5% | ||||||||
| 14,514 | IQVIA Holdings, Inc.(1) | 3,358,249 | ||||||
| 13,979 | Thermo Fisher Scientific, Inc. | 7,419,913 | ||||||
| 10,778,162 | ||||||||
| Managed Health Care-3.1% | ||||||||
| 18,579 | UnitedHealth Group, Inc. | 9,781,286 | ||||||
| Pharmaceuticals-3.2% | ||||||||
| 25,288 | Johnson & Johnson | 3,963,641 | ||||||
| 55,904 | Merck & Co., Inc. | 6,094,654 | ||||||
| 10,058,295 | ||||||||
| TOTAL HEALTH CARE | 49,910,765 | |||||||
| INDUSTRIALS-10.9% | ||||||||
| Aerospace & Defense-3.3% | ||||||||
| 72,352 | RTX Corp. | 6,087,697 | ||||||
| 56,532 | Textron, Inc. | 4,546,303 | ||||||
| 10,634,000 | ||||||||
| Construction & Farm Machinery & Heavy Trucks-0.9% | ||||||||
| 7,440 | Deere & Co. | 2,975,033 | ||||||
| Electronics-0.4% | ||||||||
| 17,642 | Fortive Corp. | 1,298,980 | ||||||
| Engineering & Construction-1.2% | ||||||||
| 29,946 | Jacobs Solutions, Inc. | 3,886,991 | ||||||
| Industrial Conglomerates-1.7% | ||||||||
| 9,822 | Roper Technologies, Inc. | 5,354,660 | ||||||
| Industrial Machinery-2.7% | ||||||||
| 15,600 | Chart Industries, Inc.(1) | 2,126,748 | ||||||
| 13,905 | Parker-Hannifin Corp. | 6,406,034 | ||||||
| 8,532,782 | ||||||||
| Shares | Value | |||||||
| Internet-0.7% | ||||||||
| 38,000 | Uber Technologies, Inc.(1) | $ | 2,339,660 | |||||
| TOTAL INDUSTRIALS | 35,022,106 | |||||||
| INFORMATION TECHNOLOGY-36.7% | ||||||||
| Application Software-3.3% | ||||||||
| 4,736 | Adobe, Inc.(1) | 2,825,498 | ||||||
| 28,090 | Salesforce, Inc.(1) | 7,391,603 | ||||||
| 10,217,101 | ||||||||
| Communication Services-1.2% | ||||||||
| 40,000 | Walt Disney Co. | 3,611,600 | ||||||
| Communications Equipment-8.1% | ||||||||
| 122,021 | Apple, Inc. | 23,492,703 | ||||||
| 10,662 | F5 Networks, Inc.(1) | 1,908,285 | ||||||
| 25,400,988 | ||||||||
| Computers-0.9% | ||||||||
| 11,632 | Crowdstrike Holdings, Inc., Class A(1) | 2,969,882 | ||||||
| Data Processing & Outsourced Services-4.1% | ||||||||
| 25,662 | Mastercard, Inc., Class A | 10,945,100 | ||||||
| 31,251 | PayPal Holdings, Inc.(1) | 1,919,124 | ||||||
| 12,864,224 | ||||||||
| Internet Software & Services-4.6% | ||||||||
| 103,260 | Alphabet, Inc., Class A(1) | 14,424,389 | ||||||
| IT Consulting & Other Services-1.1% | ||||||||
| 9,500 | Accenture PLC, Class A | 3,333,645 | ||||||
| Semiconductors-5.9% | ||||||||
| 27,068 | Advanced Micro Devices, Inc.(1) | 3,990,094 | ||||||
| 9,064 | Broadcom, Inc. | 10,117,690 | ||||||
| 17,092 | Marvell Technology Group, Ltd. | 1,030,819 | ||||||
| 42,031 | ON Semiconductor Corp.(1) | 3,510,849 | ||||||
| 18,649,452 | ||||||||
| Systems Software-7.5% | ||||||||
| 51,564 | Microsoft Corp. | 19,390,127 | ||||||
| 37,879 | Oracle Corp. | 3,993,583 | ||||||
| 23,383,710 | ||||||||
| TOTAL INFORMATION TECHNOLOGY | 114,854,991 | |||||||
| Annual Report | December 31, 2023 | |
27 |
Portfolio of Investments
| WesMark Large Company Fund | December 31, 2023 |
| Shares | Value | |||||||
| MATERIALS-1.5% | ||||||||
| Specialty Chemicals-1.5% | ||||||||
| 31,455 | PPG Industries, Inc. | $ | 4,704,095 | |||||
| TOTAL MATERIALS | 4,704,095 | |||||||
| UTILITIES-0.9% | ||||||||
| Electric Utilities-0.4% | ||||||||
| 22,614 | NextEra Energy, Inc. | 1,373,574 | ||||||
| Water-0.5% | ||||||||
| 10,995 | American Water Works Co., Inc. | 1,451,230 | ||||||
| TOTAL UTILITIES | 2,824,804 | |||||||
| TOTAL COMMON STOCKS | ||||||||
| (Cost $129,113,358) | 308,725,943 | |||||||
| SHORT TERM INVESTMENTS-2.6% | ||||||||
| Mutual Funds-2.6% | ||||||||
| 8,083,403 | Federated Hermes Government Obligations Fund, Premier Class, 7-Day Yield 5.279% (at net asset value) | 8,083,403 | ||||||
| TOTAL SHORT TERM INVESTMENTS | ||||||||
| (Cost $8,083,403) | 8,083,403 | |||||||
| TOTAL INVESTMENTS-100.8% | ||||||||
| (Cost $137,196,761) | 316,809,346 | |||||||
| OTHER ASSETS AND LIABILITIES-NET(2)-(0.8)% | (2,547,062 | ) | ||||||
| NET ASSETS-100.0% | $ | 314,262,284 | ||||||
| (1) | Non-income producing security. |
| (2) | Assets, other than investments in securities, less liabilities. |
| Note | – | The categories of investments are shown as a percentage of net assets as of December 31, 2023. |
See Notes to Financial Statements which are an integral part of
the Financial Statements.
| 28 | |
www.wesmarkfunds.com |
Portfolio of Investments Summary Table
| December 31, 2023 (Unaudited) | WesMark Balanced Fund |
As of December 31, 2023, the Fund’s Portfolio Composition(1)
was as follows:
| Portfolio Composition |
Percentage of Total Net Assets |
| COMMON STOCKS | 60.1% |
| CORPORATE BONDS | 25.1% |
| U.S. TREASURY SECURITIES | 6.2% |
| U.S. GOVERNMENT AGENCY – MORTGAGE-BACKED SECURITIES | 3.1% |
| TAXABLE MUNICIPAL BONDS | 2.5% |
| COMMERCIAL MORTGAGE-BACKED SECURITIES | 1.5% |
| U.S. GOVERNMENT AGENCY – COLLATERALIZED MORTGAGE OBLIGATIONS | 0.6% |
| FIXED INCOME PORTFOLIO SUB-TOTAL | 39.0% |
| SHORT TERM INVESTMENTS(2) | 0.5% |
| OTHER ASSETS AND LIABILITIES – NET(3) | 0.4% |
| TOTAL NET ASSETS | 100.0% |
As of December 31, 2023, the Fund’s Sector composition(4)
was as follows:
| Sector Composition | Percentage of Total Net Assets |
| Health Care | 12.3% |
| Information Technology | 12.4% |
| Industrials | 7.1% |
| Financials | 6.7% |
| Consumer Discretionary | 6.6% |
| Consumer Staples | 6.4% |
| Energy | 4.3% |
| Telecommunication Services | 1.4% |
| Utilities | 1.2% |
| Real Estate | 0.8% |
| Materials | 0.6% |
| Basic Materials | 0.3% |
| Equity Portfolio Sub-Total | 60.1% |
| Corporate Bonds | 25.1% |
| U.S. Government Securities | 9.9% |
| Taxable Municipal Bonds | 2.5% |
| Commercial Mortgage-Backed Securities | 1.5% |
| Fixed Income Portfolio Sub-Total | 39.0% |
| Short Term Investments(2) | 0.5% |
| Other Assets and Liabilities – Net(3) | 0.4% |
| Total Net Assets | 100.0% |
| (1) | See the Fund’s Prospectus and Statement of Additional Information for a description of the types of securities in which the Fund invests. |
| (2) | Short Term Investments include investment in a money market mutual fund. |
| (3) | Assets, other than investments in securities, less liabilities. |
| (4) | Securities are assigned to a sector classification by the Fund’s advisor. |
| Annual Report | December 31, 2023 | |
29 |
Portfolio of Investments
| WesMark Balanced Fund | December 31, 2023 |
| Shares/Principal Amount | Value | |||||||
| COMMON STOCKS-60.1% | ||||||||
| BASIC MATERIALS-0.3% | ||||||||
| Chemicals-0.3% | ||||||||
| 2,907 | RPM International, Inc. | $ | 324,508 | |||||
| TOTAL BASIC MATERIALS | 324,508 | |||||||
| CONSUMER DISCRETIONARY-6.6% | ||||||||
| Automobile Manufacturers-0.5% | ||||||||
| 39,570 | Ford Motor Co. | 482,358 | ||||||
| Footwear-0.8% | ||||||||
| 7,500 | NIKE, Inc., Class B | 814,275 | ||||||
| General Merchandise Stores-1.9% | ||||||||
| 12,954 | Target Corp. | 1,844,909 | ||||||
| Home Improvement Retail-1.8% | ||||||||
| 7,773 | Lowe’s Cos, Inc. | 1,729,881 | ||||||
| Restaurants-1.0% | ||||||||
| 3,487 | McDonald’s Corp. | 1,033,930 | ||||||
| Specialty Stores-0.6% | ||||||||
| 4,314 | Dick’s Sporting Goods, Inc. | 633,942 | ||||||
| TOTAL CONSUMER DISCRETIONARY | 6,539,295 | |||||||
| CONSUMER STAPLES-6.4% | ||||||||
| Food Distributors-1.1% | ||||||||
| 14,902 | Sysco Corp. | 1,089,783 | ||||||
| Hypermarkets & Super Centers-1.0% | ||||||||
| 6,329 | Walmart, Inc. | 997,767 | ||||||
| Packaged Foods & Meats-1.7% | ||||||||
| 25,000 | General Mills, Inc. | 1,628,500 | ||||||
| Soft Drinks-2.6% | ||||||||
| 14,886 | PepsiCo, Inc. | 2,528,238 | ||||||
| TOTAL CONSUMER STAPLES | 6,244,288 | |||||||
| Shares/Principal Amount | Value | |||||||
| ENERGY-4.3% | ||||||||
| Integrated Oil & Gas-3.3% | ||||||||
| 21,913 | Chevron Corp. | $ | 3,268,543 | |||||
| Oil & Gas Exploration & Production-0.3% | ||||||||
| 2,099 | EOG Resources, Inc. | 253,874 | ||||||
| Oil & Gas Refining & Marketing-0.7% | ||||||||
| 5,117 | Valero Energy Corp. | 665,210 | ||||||
| TOTAL ENERGY | 4,187,627 | |||||||
| FINANCIALS-6.7% | ||||||||
| Asset Management & Custody Banks-1.2% | ||||||||
| 15,471 | State Street Corp. | 1,198,384 | ||||||
| Diversified Banks-2.7% | ||||||||
| 13,409 | JPMorgan Chase & Co. | 2,280,871 | ||||||
| 10,009 | US Bancorp | 433,190 | ||||||
| 2,714,061 | ||||||||
| Investment Banking & Brokerage-1.5% | ||||||||
| 3,805 | The Goldman Sachs Group, Inc. | 1,467,855 | ||||||
| Regional Banks-1.3% | ||||||||
| 8,000 | PNC Financial Services Group, Inc. | 1,238,800 | ||||||
| TOTAL FINANCIALS | 6,619,100 | |||||||
| HEALTH CARE-12.3% | ||||||||
| Biotechnology-3.1% | ||||||||
| 20,000 | AbbVie, Inc. | 3,099,400 | ||||||
| Health Care Services-2.4% | ||||||||
| 30,000 | CVS Health Corp. | 2,368,800 | ||||||
| Pharmaceuticals-6.8% | ||||||||
| 1,444 | Cigna Group | 432,406 | ||||||
| 5,145 | Eli Lilly & Co. | 2,999,123 | ||||||
| 17,956 | Merck & Co., Inc. | 1,957,563 | ||||||
| 47,725 | Pfizer, Inc. | 1,374,003 | ||||||
| 6,763,095 | ||||||||
| TOTAL HEALTH CARE | 12,231,295 | |||||||
| 30 | |
www.wesmarkfunds.com |
Portfolio of Investments
| December 31, 2023 | WesMark Balanced Fund |
| Shares/Principal Amount | Value | |||||||
| INDUSTRIALS-7.1% | ||||||||
| Aerospace & Defense-0.6% | ||||||||
| 2,600 | L3Harris Technologies, Inc. | $ | 547,612 | |||||
| Air Freight & Logistics-1.5% | ||||||||
| 9,508 | United Parcel Service, Inc., Class B | 1,494,943 | ||||||
| Construction & Farm Machinery & Heavy Trucks-0.2% | ||||||||
| 519 | Deere & Co. | 207,533 | ||||||
| Construction Machinery & Heavy Equipment-2.6% | ||||||||
| 8,825 | Caterpillar, Inc. | 2,609,288 | ||||||
| Electrical Components & Equipment-2.2% | ||||||||
| 22,000 | Emerson Electric Co. | 2,141,260 | ||||||
| TOTAL INDUSTRIALS | 7,000,636 | |||||||
| INFORMATION TECHNOLOGY-12.4% | ||||||||
| Communications Equipment-8.8% | ||||||||
| 29,567 | Apple, Inc. | 5,692,534 | ||||||
| 58,222 | Cisco Systems, Inc. | 2,941,375 | ||||||
| 8,633,909 | ||||||||
| IT Consulting & Other Services-0.6% | ||||||||
| 3,400 | International Business Machines Corp. | 556,070 | ||||||
| Semiconductors-3.0% | ||||||||
| 3,432 | Analog Devices, Inc. | 681,458 | ||||||
| 13,545 | Texas Instruments, Inc. | 2,308,881 | ||||||
| 2,990,339 | ||||||||
| TOTAL INFORMATION TECHNOLOGY | 12,180,318 | |||||||
| MATERIALS-0.6% | ||||||||
| Industrial Gases-0.6% | ||||||||
| 2,326 | Air Products & Chemicals, Inc. | 636,859 | ||||||
| TOTAL MATERIALS | 636,859 | |||||||
| REAL ESTATE-0.8% | ||||||||
| Specialized REITS-0.8% | ||||||||
| 11,408 | CubeSmart REIT | 528,761 | ||||||
| Shares/Principal Amount | Value | |||||||
| 2,400 | Digital Realty Trust, Inc. REIT | $ | 322,992 | |||||
| 851,753 | ||||||||
| TOTAL REAL ESTATE | 851,753 | |||||||
| TELECOMMUNICATION SERVICES-1.4% | ||||||||
| Integrated Telecommunication Services-1.4% | ||||||||
| 82,000 | AT&T, Inc. | 1,375,960 | ||||||
| TOTAL TELECOMMUNICATION SERVICES | 1,375,960 | |||||||
| UTILITIES-1.2% | ||||||||
| Electric Utilities-1.0% | ||||||||
| 9,886 | Duke Energy Corp. | 959,337 | ||||||
| Multi-Utilities-0.2% | ||||||||
| 4,599 | Dominion Energy, Inc. | 216,153 | ||||||
| TOTAL UTILITIES | 1,175,490 | |||||||
| TOTAL COMMON STOCKS | ||||||||
| (Cost $31,556,518) | 59,367,129 | |||||||
| CORPORATE BONDS-25.1% | ||||||||
| Auto Manufacturers-0.5% | ||||||||
| $ | 550,000 | American Honda Finance Corp., 1.800%, 1/13/2031 | 465,194 | |||||
| Banks-1.7% | ||||||||
| 500,000 | Fifth Third Bank NA, 3.850%, 3/15/2026 | 481,080 | ||||||
| 500,000 | Morgan Stanley, 1D US SOFR + 0.525%, 5/30/2025(1) | 488,939 | ||||||
| 500,000 | PNC Financial Services Group, Inc., 1D US SOFR + 2.284%, 10/20/2034(1) | 555,280 | ||||||
| 150,000 | PNC Bank NA, 2.700%, 10/22/2029 | 131,618 | ||||||
| 1,656,917 | ||||||||
| Beverages-0.5% | ||||||||
| 500,000 | Anheuser-Busch InBev Worldwide, Inc., 4.900%, 1/23/2031 | 520,600 | ||||||
| Chemicals-0.5% | ||||||||
| 500,000 | Chevron Phillips Chemical Co. LLC / Chevron Phillips Chemical Co LP, 5.125%, 4/1/2025(2) | 500,327 | ||||||
| Annual Report | December 31, 2023 | |
31 |
Portfolio of Investments
| WesMark Balanced Fund | December 31, 2023 |
| Shares/Principal Amount | Value | |||||||
| Commercial Services-0.5% | ||||||||
| $ | 500,000 | PayPal Holdings, Inc., 4.400%, 6/1/2032 | $ | 497,077 | ||||
| Computers-0.5% | ||||||||
| 500,000 | Dell International LLC / EMC Corp., 5.750%, 2/1/2033 | 527,091 | ||||||
| Diversified Financial Services-2.0% | ||||||||
| 500,000 | American Express Co., 3.400%, 2/22/2024 | 499,454 | ||||||
| 500,000 | American Express Co., 1D US SOFR + 1.835%, 5/1/2034(1) | 499,360 | ||||||
| 250,000 | BlackRock, Inc., 2.400%, 4/30/2030 | 223,454 | ||||||
| 250,000 | Legg Mason, Inc., 4.750%, 3/15/2026 | 249,254 | ||||||
| 500,000 | Charles Schwab Corp., 1D US SOFR + 2.50%, 5/19/2034(1) | 516,391 | ||||||
| 1,987,913 | ||||||||
| Diversified Manufacturing-1.0% | ||||||||
| 1,000,000 | 3M Co., 3.375%, 3/1/2029 | 936,298 | ||||||
| Electric-2.5% | ||||||||
| 500,000 | CenterPoint Energy Houston Electric LLC, 4.450%, 10/1/2032 | 492,049 | ||||||
| 500,000 | Duke Energy Corp., 4.300%, 3/15/2028 | 493,359 | ||||||
| 500,000 | NextEra Energy Capital Holdings, Inc., 3.550%, 5/1/2027 | 481,900 | ||||||
| 500,000 | NextEra Energy Capital Holdings, Inc., 5.000%, 7/15/2032 | 502,920 | ||||||
| 500,000 | Wisconsin Electric Power Co., 4.750%, 9/30/2032 | 504,520 | ||||||
| 2,474,748 | ||||||||
| Electronics-0.7% | ||||||||
| 500,000 | Honeywell International, Inc., 4.500%, 1/15/2034 | 502,746 | ||||||
| 175,000 | Honeywell International, Inc., 5.700%, 3/15/2037 | 191,803 | ||||||
| 694,549 | ||||||||
| Engineering&Construction-0.5% | ||||||||
| 500,000 | Jacobs Engineering Group, Inc., 5.900%, 3/1/2033 | 510,926 | ||||||
| Shares/Principal Amount | Value | |||||||
| Environmental Control-1.6% | ||||||||
| $ | 500,000 | Republic Services, Inc., 3.200%, 3/15/2025 | $ | 488,732 | ||||
| 500,000 | Republic Services, Inc., 5.700%, 5/15/2041 | 538,393 | ||||||
| 500,000 | Waste Management, Inc., 3.500%, 5/15/2024 | 495,922 | ||||||
| 1,523,047 | ||||||||
| Healthcare-Products-0.5% | ||||||||
| 500,000 | GE HealthCare Technologies, Inc., 5.650%, 11/15/2027 | 517,797 | ||||||
| Industrial Gases-0.8% | ||||||||
| 835,000 | Air Products & Chemicals, Inc., Sr. Unsecured Notes, 3.350%, 7/31/2024 | 824,554 | ||||||
| Insurance-1.9% | ||||||||
| 500,000 | Berkshire Hathaway Finance Corp., 2.875%, 3/15/2032 | 451,052 | ||||||
| 400,000 | Marsh & McLennan Cos., Inc., 2.375%, 12/15/2031 | 340,983 | ||||||
| 500,000 | MetLife, Inc., 5.875%, 2/6/2041 | 545,747 | ||||||
| 500,000 | Progressive Corp., 4.950%, 6/15/2033 | 513,372 | ||||||
| 1,851,154 | ||||||||
| Internet-0.2% | ||||||||
| 250,000 | Expedia Group, Inc., 3.800%, 2/15/2028 | 241,224 | ||||||
| Lodging-0.5% | ||||||||
| 500,000 | Marriott International, Inc., 4.900%, 4/15/2029 | 503,583 | ||||||
| Machinery-Constr&Mining-0.5% | ||||||||
| 500,000 | Caterpillar Financial Services Corp., 3.600%, 8/12/2027 | 488,554 | ||||||
| Machinery-Diversified-0.5% | ||||||||
| 500,000 | Ingersoll Rand, Inc., 5.700%, 8/14/2033 | 529,239 | ||||||
| Oil&Gas-0.8% | ||||||||
| 500,000 | Marathon Oil Corp., 6.600%, 10/1/2037 | 529,151 | ||||||
| 32 | |
www.wesmarkfunds.com |
Portfolio of Investments
| December 31, 2023 | WesMark Balanced Fund |
| Shares/Principal Amount | Value | |||||||
| $ | 250,000 | Phillips 66, 4.650%, 11/15/2034 | $ | 243,356 | ||||
| 772,507 | ||||||||
| Pharmaceuticals-1.1% | ||||||||
| 500,000 | AbbVie, Inc., 3.200%, 11/21/2029(2) | 466,834 | ||||||
| 175,000 | AbbVie, Inc., 4.550%, 3/15/2035 | 171,697 | ||||||
| 250,000 | Bristol-Myers Squibb Co., 3.900%, 2/20/2028 | 245,774 | ||||||
| 175,000 | GlaxoSmithKline Capital, Inc., 6.375%, 5/15/2038 | 203,388 | ||||||
| 1,087,693 | ||||||||
| Pipelines-0.5% | ||||||||
| 500,000 | ONEOK, Inc., 5.800%, 11/1/2030 | 520,119 | ||||||
| Regional Banks-1.0% | ||||||||
| 1,000,000 | PNC Bank NA, Sr. Unsecured Notes, 3.250%, 6/1/2025 | 973,345 | ||||||
| Retail-2.5% | ||||||||
| 250,000 | Dollar Tree, Inc., 4.200%, 5/15/2028 | 244,772 | ||||||
| 175,000 | Home Depot, Inc., 5.875%, 12/16/2036 | 195,754 | ||||||
| 500,000 | O’Reilly Automotive, Inc., 4.350%, 6/1/2028 | 496,307 | ||||||
| 500,000 | Target Corp., 4.400%, 1/15/2033 | 505,176 | ||||||
| 500,000 | Walmart, Inc., 5.250%, 9/1/2035 | 546,685 | ||||||
| 500,000 | Walmart, Inc., 3.950%, 6/28/2038 | 476,870 | ||||||
| 2,465,564 | ||||||||
| Software-0.5% | ||||||||
| 500,000 | Activision Blizzard, Inc., 3.400%, 9/15/2026 | 487,503 | ||||||
| Software & Services-0.8% | ||||||||
| 750,000 | Oracle Corp., Sr. Unsecured Notes, 3.400%, 7/8/2024 | 741,437 | ||||||
| Transportation Services-0.5% | ||||||||
| 500,000 | FedEx Corp., 4.250%, 5/15/2030 | 488,919 | ||||||
| TOTAL CORPORATE BONDS | ||||||||
| (Cost $25,027,540) | 24,787,879 | |||||||
| U.S. GOVERNMENT AGENCY – COLLATERALIZED MORTGAGE OBLIGATIONS–0.6% | ||||||||
| Federal Home Loan Mortgage Corp.–0.1% | ||||||||
| 129,972 | Series 2015-4517, Class PC, 2.500%, 5/15/2044 | 121,241 | ||||||
| Shares/Principal Amount | Value | |||||||
| Government National Mortgage Association-0.5% | ||||||||
| $ | 445,844 | Series 2018-126, Class DA, 3.500%, 1/20/2048 | $ | 425,793 | ||||
| TOTAL U.S. GOVERNMENT AGENCY – COLLATERALIZED MORTGAGE OBLIGATIONS | ||||||||
| (Cost $575,066) | 547,034 | |||||||
| COMMERCIAL MORTGAGE-BACKED SECURITIES-1.5% | ||||||||
| Commercial Mortgage-Backed Securities-1.5% | ||||||||
| 1,500,000 | Series 2015-UBS8, Class A4, 3.809%, 11/15/2025 | 1,444,561 | ||||||
| TOTAL COMMERCIAL MORTGAGE-BACKED SECURITIES | ||||||||
| (Cost $1,535,187) | 1,444,561 | |||||||
| U.S. GOVERNMENT AGENCY – MORTGAGE-BACKED SECURITIES-3.1% | ||||||||
| Federal Home Loan Mortgage Corp.-0.3% | ||||||||
| 58,522 | Pool G18527, 3.000%, 10/1/2029 | 56,489 | ||||||
| 244,055 | Pool 18707, 3.500%, 9/1/2033 | 240,025 | ||||||
| 296,514 | ||||||||
| Federal National Mortgage Association-1.9% | ||||||||
| 707,096 | Pool BL5389, 2.710%, 5/1/2027 | 669,066 | ||||||
| 579,411 | Pool AM6756, 3.570%, 10/1/2029 | 557,424 | ||||||
| 145,017 | Pool MA3621, 3.500%, 3/1/2039 | 137,363 | ||||||
| 44,248 | Pool BN4896, 4.000%, 1/1/2049 | 42,456 | ||||||
| 122,347 | Pool MA3592, 4.000%, 2/1/2049 | 117,618 | ||||||
| 358,290 | Pool BP4338, 1Y US TI + 1.67%, 3/1/2049(1) | 353,287 | ||||||
| 1,877,214 | ||||||||
| Small Business Administration Pools-0.4% | ||||||||
| 148,406 | PRIME – 3.50%, 1/25/2042(1) | 149,957 | ||||||
| 233,381 | PRIME – 3.50%, 7/25/2042(1) | 235,224 | ||||||
| 385,181 | ||||||||
| UMBS Collateral-0.5% | ||||||||
| 465,799 | 5.000%, 12/1/2052 | 461,390 | ||||||
| TOTAL U.S. GOVERNMENT AGENCY – MORTGAGE-BACKED SECURITIES | ||||||||
| (Cost $3,152,024) | 3,020,299 | |||||||
| Annual Report | December 31, 2023 | |
33 |
Portfolio of Investments
| WesMark Balanced Fund | December 31, 2023 |
| Shares/Principal Amount | Value | |||||||
| U.S. TREASURY SECURITIES-6.2% | ||||||||
| Federal Home Loan Banks-0.8% | ||||||||
| $ | 750,000 | 4.625%, 11/17/2026 | $ | 760,792 | ||||
| U.S. Treasury Bond-2.5% | ||||||||
| 150,000 | 4.500%, 2/15/2036 | 160,043 | ||||||
| 150,000 | 4.750%, 2/15/2037 | 164,215 | ||||||
| 500,000 | 3.500%, 2/15/2039 | 473,799 | ||||||
| 500,000 | 2.875%, 8/15/2028 | 478,594 | ||||||
| 500,000 | 4.125%, 11/15/2032 | 508,427 | ||||||
| 750,000 | 3.500%, 2/15/2033 | 727,617 | ||||||
| 2,512,695 | ||||||||
| U.S. Treasury Note-2.9% | ||||||||
| 1,500,000 | 4.500%, 11/30/2024 | 1,494,558 | ||||||
| 100,000 | 3.875%, 11/30/2027 | 99,803 | ||||||
| 500,000 | 4.000%, 12/15/2025 | 497,393 | ||||||
| 750,000 | 3.500%, 1/31/2030 | 733,696 | ||||||
| 2,825,450 | ||||||||
| TOTAL U.S. TREASURY SECURITIES | ||||||||
| (Cost $6,139,799) | 6,098,937 | |||||||
| TAXABLE MUNICIPAL BONDS-2.5% | ||||||||
| California-0.2% | ||||||||
| 200,000 | Charter Oak Unified School District, 2.681%, 8/1/2036 | 158,778 | ||||||
| Michigan-0.3% | ||||||||
| 270,000 | Belding Area Schools, General Obligation Unlimited Bonds, 6.700%, 5/1/2027 | 270,489 | ||||||
| Ohio-0.7% | ||||||||
| 660,000 | Columbus-Franklin County Finance Authority, 4.490%, 11/15/2032 | 643,718 | ||||||
| Pennsylvania-0.4% | ||||||||
| 450,000 | Commonwealth Financing Authority, 4.014%, 6/1/2033 | 423,249 | ||||||
| Utah-0.4% | ||||||||
| 450,000 | Utah Transit Authority, 3.393%, 12/15/2036 | 387,111 | ||||||
| Shares/Principal Amount | Value | |||||||
| West Virginia-0.5% | ||||||||
| $ | 575,000 | Marshall University, 3.177%, 5/1/2029 | $ | 536,636 | ||||
| TOTAL TAXABLE MUNICIPAL BONDS | ||||||||
| (Cost $2,619,195) | 2,419,981 | |||||||
| SHORT TERM INVESTMENTS-0.5% | ||||||||
| Mutual Funds-0.5% | ||||||||
| 486,475 | Federated Hermes Government Obligations Fund, Premier Class, 7-Day Yield 5.279% (at net asset value) | 486,475 | ||||||
| TOTAL SHORT TERM INVESTMENTS | ||||||||
| (Cost $486,475) | 486,475 | |||||||
| TOTAL INVESTMENTS-99.6% | ||||||||
| (Cost $71,091,804) | 98,172,295 | |||||||
| OTHER ASSETS AND LIABILITIES-NET(3)-0.4% | 426,009 | |||||||
| NET ASSETS-100.0% | $ | 98,598,304 | ||||||
| 34 | |
www.wesmarkfunds.com |
Portfolio of Investments
| December 31, 2023 | WesMark Balanced Fund |
Investment Abbreviations:
SOFR – Secured Overnight Financing Rate
TI – Treasury Index
Reference Rates:
1D US SOFR – 1 Day SOFR as of December 31, 2023 was 5.31%
1Y US TI – 1 Year US TI as of December 31, 2023 was 4.80%
PRIME – US Prime Rate as of December 31, 2023 was 8.50%
| (1) | Floating or variable rate security. The reference rate is described above. The Rate in effect as of December 31, 2023 is based on the reference rate plus the displayed spread as of the security’s last reset date. |
| (2) | Security exempt from registration under rule 144A of the Securities Act of 1933. These securities may be resold in transactions exempt from registration, normally to qualified institutional buyers. As of December 31, 2023, these securities amounted to a value of $967,161 or 0.98% of net assets. These Securities have been determined to be liquid pursuant to procedures adopted by the board. |
| (3) | Assets, other than investments in securities, less liabilities. |
| Note | – | The categories of investments are shown as a percentage of net assets as of December 31, 2023. |
See Notes to Financial Statements which are an integral part of
the Financial Statements.
| Annual Report | December 31, 2023 | |
35 |
Portfolio of Investments Summary Table
| WesMark Government Bond Fund | December 31, 2023 (Unaudited) |
As of December 31, 2023, the Fund’s Portfolio Composition(1)
was as follows:
| Portfolio Composition | Percentage of Total Net Assets |
| EXCHANGE TRADED FUNDS (ETF) | 2.0% |
| U.S. GOVERNMENT AGENCY – MORTGAGE-BACKED SECURITIES | 39.6% |
| U.S. GOVERNMENT AGENCY SECURITIES | 21.7% |
| U.S. TREASURY – SECURITIES | 16.4% |
| CORPORATE BONDS | 8.0% |
| TAXABLE MUNICIPAL BONDS | 7.1% |
| FIXED INCOME PORTFOLIO SUB-TOTAL | 92.8% |
| SHORT TERM INVESTMENTS(2) | 5.0% |
| OTHER ASSETS AND LIABILITIES – NET(3) | 0.2% |
| TOTAL NET ASSETS | 100.0% |
| (1) | See the Fund’s Prospectus and Statement of Additional Information for a description of the types of securities in which the Fund invests. |
| (2) | Short Term Investments include investment in a money market mutual fund. |
| (3) | Assets, other than investments in securities, less liabilities. |
| 36 | |
www.wesmarkfunds.com |
Portfolio of Investments
| December 31, 2023 | WesMark Government Bond Fund |
| Shares/Principal Amount | Value | |||||||
| EXCHANGE TRADED FUNDS-2.0% | ||||||||
| 4,602 | iShares® 20+ Year Treasury Bond ETF | $ | 455,046 | |||||
| 28,924 | iShares® iBoxx $ Investment Grade Corporate Bond ETF | 3,200,730 | ||||||
| TOTAL EXCHANGE TRADED FUNDS | ||||||||
| (Cost $3,674,430) | 3,655,776 | |||||||
| CORPORATE BONDS-8.0% | ||||||||
| Banks-4.1% | ||||||||
| $ | 1,000,000 | Citigroup, Inc., 5.400%, 1/20/2026 | 994,700 | |||||
| 500,000 | FNB Corp., 4.875%, 10/2/2025 | 482,660 | ||||||
| 1,000,000 | Fifth Third Bank NA, 3.850%, 3/15/2026 | 962,161 | ||||||
| 1,000,000 | First Horizon Bank, 5.750%, 5/1/2030 | 943,743 | ||||||
| 500,000 | Wells Fargo Bank NA, 6.180%, 2/15/2036 | 501,726 | ||||||
| 500,000 | Morgan Stanley, 1D US SOFR + 2.62%, 4/20/2037(1) | 486,793 | ||||||
| 500,000 | PNC Financial Services Group, Inc., SOFRINDX + 1.73%, 10/20/2027(1) | 518,873 | ||||||
| 1,000,000 | PNC Financial Services Group, Inc., SOFRINDX + 2.14%, 10/28/2033(1) | 1,045,351 | ||||||
| 500,000 | PNC Financial Services Group, Inc., 1D US SOFR + 1.946%, 8/18/2034(1) | 520,107 | ||||||
| 1,000,000 | US Bancorp, 1D US SOFR + 1.60%, 2/1/2034(1) | 958,321 | ||||||
| 7,414,435 | ||||||||
| Biotechnology-1.1% | ||||||||
| 2,000,000 | Amgen, Inc., 5.250%, 3/2/2033 | 2,051,192 | ||||||
| Healthcare-Services-1.2% | ||||||||
| 2,000,000 | Aetna, Inc., 6.750%, 12/15/2037 | 2,247,060 | ||||||
| Pipelines-0.5% | ||||||||
| 1,000,000 | Kinder Morgan, Inc., 5.200%, 6/1/2033 | 994,526 | ||||||
| Retail-1.1% | ||||||||
| 2,000,000 | AutoZone, Inc., 4.750%, 2/1/2033 | 1,969,726 | ||||||
| TOTAL CORPORATE BONDS | ||||||||
| (Cost $14,528,120) | 14,676,939 | |||||||
| Shares/Principal Amount | Value | |||||||
| U.S. GOVERNMENT AGENCY – COLLATERALIZED | ||||||||
| MORTGAGE OBLIGATIONS-21.7% | ||||||||
| Agency Collat CMO-5.4% | ||||||||
| $ | 223,471 | Series 2003-55, Class 1A3A, 30D US SOFR + 0.51448%, 3/25/2043(1) | $ | 223,519 | ||||
| 637,439 | Series 2004-W14, Class 1AF, 30D US SOFR + 0.51448%, 7/25/2044(1) | 594,083 | ||||||
| 600,495 | Series 2010-59, Class FL, 1M CME TERM SOFR + 0.61448%, 5/20/2040(1) | 593,943 | ||||||
| 2,383,755 | Series 2014-330, Class F4, 30D US SOFR + 0.46448%, 10/15/2037(1) | 2,351,865 | ||||||
| 2,642,080 | Series 2022-76, Class D, 5.500%, 8/25/2045 | 2,659,428 | ||||||
| 3,456,987 | Series 2022-83, Class DA, 6.000%, 1/25/2048 | 3,492,276 | ||||||
| 9,915,114 | ||||||||
| Agency Collat PAC CMO-4.0% | ||||||||
| 3,906,648 | Series 2020-5020, Class TP, 2.000%, 10/25/2050 | 3,124,807 | ||||||
| 1,913,891 | Series 2020-153, Class GP, 0.500%, 10/20/2050 | 1,689,292 | ||||||
| 3,447,988 | Series 2021-23, Class TE, 1.000%, 2/20/2051 | 2,576,218 | ||||||
| 7,390,317 | ||||||||
| Commercial MBS-4.1% | ||||||||
| 2,608,691 | Series 2020-177, Class DA, 1.250%, 6/16/2062 | 1,681,195 | ||||||
| 5,000,000 | Series 2021-181, Class B, 1.900%, 1/16/2063 | 2,940,902 | ||||||
| 5,000,000 | Series 2021-203, Class B, 2.000%, 4/16/2062 | 2,962,544 | ||||||
| 7,584,641 | ||||||||
| Federal Home Loan Mortgage Corp.-0.3% | ||||||||
| 635,959 | Series 2016-4629, Class QG, 2.500%, 11/15/2046, REMIC | 548,592 | ||||||
| Federal National Mortgage Association-1.0% | ||||||||
| 661,337 | Series 2003-W18, Class 2A, 4.356%, 6/25/2043, REMIC (1) | 648,661 | ||||||
| 810,741 | Series 2016-90, Class DA, 3.000%, 8/25/2046, REMIC | 710,970 | ||||||
| 467,246 | Series 2019-74, Class LB, 3.000%, 10/25/2049 | 422,184 | ||||||
| 1,781,815 | ||||||||
| Annual Report | December 31, 2023 | |
37 |
Portfolio of Investments
| WesMark Government Bond Fund | December 31, 2023 |
| Shares/Principal Amount | Value | |||||||
| Government National Mortgage Association-0.3% | ||||||||
| $ | 537,698 | Series 2013-38, Class KA, 1.250%, 2/20/2042 | $ | 480,548 | ||||
| Sovereign-6.6% | ||||||||
| 2,000,000 | 3.560%, 11/30/2043 | 1,650,072 | ||||||
| 2,000,000 | 3.330%, 9/5/2045 | 1,567,633 | ||||||
| 2,000,000 | 3.730%, 10/22/2032 | 1,917,780 | ||||||
| 2,000,000 | 1.910%, 5/17/2034 | 1,593,392 | ||||||
| 500,000 | 4.900%, 6/29/2032 | 491,493 | ||||||
| 3,000,000 | 3.330%, 7/12/2032 | 2,797,932 | ||||||
| 2,000,000 | 4.000%, 2/9/2033 | 1,956,688 | ||||||
| 11,974,990 | ||||||||
| TOTAL U.S. GOVERNMENT AGENCY – COLLATERALIZED MORTGAGE OBLIGATIONS | ||||||||
| (Cost $46,750,863) | 39,676,017 | |||||||
| U.S. GOVERNMENT AGENCY – MORTGAGE-BACKED SECURITIES–39.6% | ||||||||
| Federal Home Loan Mortgage Corp.-0.6% | ||||||||
| 1,199,383 | Freddie Mac Pool, Pool QA6315, 3.500%, 1/1/2050 | 1,129,869 | ||||||
| FNMA Collateral-0.9% | ||||||||
| 1,847,693 | Fannie Mae Pool, Pool MA2711, 3.000%, 8/1/2046 | 1,642,286 | ||||||
| GNMA2 Collateral-4.1% | ||||||||
| 2,701,117 | Ginnie Mae II Pool, 4.000%, 8/20/2052 | 2,535,571 | ||||||
| 3,204,677 | Ginnie Mae II Pool, 5.500%, 11/20/2052 | 3,183,701 | ||||||
| 1,749,802 | Ginnie Mae II Pool, 5.500%, 12/20/2052 | 1,738,349 | ||||||
| 7,457,621 | ||||||||
| Government National Mortgage Association-0.1% | ||||||||
| 114,442 | Ginnie Mae I Pool, Pool 589693, 4.500%, 7/15/2029 | 111,483 | ||||||
| Sovereign-1.0% | ||||||||
| 2,000,000 | Federal Home Loan Banks, 3.700%, 6/22/2035 | 1,878,049 | ||||||
| UMBS Collateral-32.9% | ||||||||
| 4,558,585 | Freddie Mac Pool, 4.000%, 6/1/2052 | 4,313,669 | ||||||
| 4,628,412 | Freddie Mac Pool, 4.500%, 10/1/2052 | 4,489,782 | ||||||
| Shares/Principal Amount | Value | |||||||
| $ | 2,845,555 | Freddie Mac Pool, 4.000%, 11/1/2052 | $ | 2,691,508 | ||||
| 4,721,764 | Freddie Mac Pool, 5.000%, 1/1/2053 | 4,674,872 | ||||||
| 4,768,022 | Freddie Mac Pool, 5.000%, 2/1/2053 | 4,718,908 | ||||||
| 974,215 | Freddie Mac Pool, 5.500%, 9/1/2053 | 978,382 | ||||||
| 3,858,879 | Freddie Mac Pool, 6.000%, 9/1/2053 | 3,919,070 | ||||||
| 2,041,902 | Fannie Mae Pool, 4.500%, 7/1/2042 | 2,015,934 | ||||||
| 4,367,559 | Fannie Mae Pool, 4.500%, 10/1/2042 | 4,324,509 | ||||||
| 4,442,349 | Fannie Mae Pool, 4.500%, 11/1/2042 | 4,398,568 | ||||||
| 2,030,694 | Fannie Mae Pool, 4.500%, 1/1/2043 | 2,010,688 | ||||||
| 2,643,691 | Fannie Mae Pool, 5.500%, 1/1/2043 | 2,682,675 | ||||||
| 4,546,877 | Fannie Mae Pool, 4.000%, 6/1/2052 | 4,302,739 | ||||||
| 4,548,975 | Fannie Mae Pool, 4.500%, 7/1/2052 | 4,412,724 | ||||||
| 2,719,691 | Fannie Mae Pool, 5.500%, 11/1/2052 | 2,739,428 | ||||||
| 2,608,164 | Fannie Mae Pool, 6.000%, 11/1/2052 | 2,656,844 | ||||||
| 4,728,407 | Fannie Mae Pool, 5.000%, 2/1/2053 | 4,679,701 | ||||||
| 60,010,001 | ||||||||
| TOTAL U.S. GOVERNMENT AGENCY – MORTGAGE-BACKED SECURITIES | ||||||||
| (Cost $73,785,105) | 72,229,309 | |||||||
| U.S. TREASURY SECURITIES–16.4% | ||||||||
| Tennessee Valley Authority-0.6% | ||||||||
| 1,000,000 | 5.880%, 4/1/2036 | 1,143,318 | ||||||
| Tennessee Valley Authority Generic Strip-0.2% | ||||||||
| 1,000,000 | –%, 1/15/2047(2) | 311,829 | ||||||
| U.S. Treasury Bond-6.2% | ||||||||
| 1,000,000 | 3.750%, 11/15/2043 | 934,961 | ||||||
| 1,000,000 | 1.125%, 8/15/2040 | 638,828 | ||||||
| 2,000,000 | 1.750%, 8/15/2041 | 1,391,797 | ||||||
| 2,000,000 | 2.000%, 11/15/2041 | 1,447,383 | ||||||
| 2,000,000 | 2.375%, 2/15/2042 | 1,535,391 | ||||||
| 3,000,000 | 2.875%, 5/15/2028 | 2,877,480 | ||||||
| 2,500,000 | 2.875%, 8/15/2028 | 2,392,969 | ||||||
| 11,218,809 | ||||||||
| U.S. Treasury Note-4.2% | ||||||||
| 2,000,000 | 1.500%, 2/15/2030 | 1,742,813 | ||||||
| 2,000,000 | 0.625%, 8/15/2030 | 1,622,656 | ||||||
| 2,500,000 | 2.750%, 5/31/2029 | 2,360,742 | ||||||
| 2,000,000 | 4.000%, 2/15/2026 | 1,991,133 | ||||||
| 7,717,344 | ||||||||
| United States Treasury Strip Coupon-5.2% | ||||||||
| 2,200,000 | –%, 11/15/2040(2) | 1,061,854 | ||||||
| 2,275,000 | –%, 8/15/2041(2) | 1,055,195 | ||||||
| 2,220,000 | –%, 2/15/2042(2) | 1,005,117 | ||||||
| 4,565,000 | –%, 5/15/2042(2) | 2,038,397 | ||||||
| 38 | |
www.wesmarkfunds.com |
Portfolio of Investments
| December 31, 2023 | WesMark Government Bond Fund |
| Shares/Principal Amount | Value | |||||||
| $ | 2,265,000 | –%, 8/15/2042(2) | $ | 999,377 | ||||
| 3,000,000 | –%, 5/15/2043(2) | 1,277,914 | ||||||
| 2,500,000 | –%, 8/15/2043(2) | 1,053,808 | ||||||
| 2,500,000 | –%, 11/15/2043(2) | 1,042,274 | ||||||
| 9,533,936 | ||||||||
| TOTAL U.S. TREASURY SECURITIES | ||||||||
| (Cost $29,831,322) | 29,925,236 | |||||||
| TAXABLE MUNICIPAL BONDS-7.1% | ||||||||
| Arkansas-0.7% | ||||||||
| University of Arkansas: | ||||||||
| 500,000 | 3.382%, 9/1/2037 | 430,764 | ||||||
| 1,000,000 | 3.301%, 11/1/2039 | 837,815 | ||||||
| 1,268,579 | ||||||||
| California-1.9% | ||||||||
| 500,000 | Bonita Unified School District, 2.619%, 8/1/2035 | 402,255 | ||||||
| 1,000,000 | Contra Costa Community College District, 2.926%, 8/1/2038 | 818,079 | ||||||
| 500,000 | Desert Community College District, 2.978%, 8/1/2037 | 404,872 | ||||||
| 500,000 | Kings Canyon Unified School District, 3.212%, 8/1/2040 | 402,643 | ||||||
| 500,000 | Pasadena Public Financing Authority, Build America Revenue Bonds, Series B, 6.998%, 3/1/2034 | 590,932 | ||||||
| 910,000 | Santa Paula Utility Authority, 2.870%, 2/1/2034 | 778,216 | ||||||
| 3,396,997 | ||||||||
| Hawaii-0.5% | ||||||||
| 1,000,000 | University of Hawaii, 3.850%, 10/1/2038 | 888,224 | ||||||
| Massachusetts-1.0% | ||||||||
| 1,000,000 | City of Quincy MA, 2.788%, 12/15/2035 | 809,169 | ||||||
| 1,500,000 | Massachusetts School Building Authority, 2.950%, 5/15/2043 | 1,104,544 | ||||||
| 1,913,713 | ||||||||
| Michigan-0.6% | ||||||||
| 1,400,000 | Michigan State Building Authority, 2.705%, 10/15/2040 | 1,068,297 | ||||||
| New York-0.4% | ||||||||
| 700,000 | City of New York NY, 5.985%, 12/1/2036 | 747,722 | ||||||
| Shares/Principal Amount | Value | |||||||
| Ohio-0.5% | ||||||||
| $ | 565,000 | Summit County Development Finance Authority, 3.201%, 11/15/2036 | $ | 475,928 | ||||
| 500,000 | Warrensville Heights City School District, 3.406%, 12/1/2040 | 410,450 | ||||||
| 886,378 | ||||||||
| Pennsylvania-0.2% | ||||||||
| 550,000 | Borough of Columbia PA, 2.540%, 6/15/2038 | 418,679 | ||||||
| Texas-0.2% | ||||||||
| 500,000 | Round Rock Transportation & Economic Development Corp., 3.000%, 8/15/2039 | 386,909 | ||||||
| Virginia-0.6% | ||||||||
| 1,395,000 | Virginia Housing Development Authority, 3.050%, 8/1/2038 | 1,082,277 | ||||||
| West Virginia-0.5% | ||||||||
| 1,000,000 | Wheeling Municipal Building Commission, 5.558%, 8/1/2037 | 957,409 | ||||||
| TOTAL TAXABLE MUNICIPAL BONDS | ||||||||
| (Cost $15,923,308) | 13,015,184 | |||||||
| SHORT TERM INVESTMENTS-5.0% | ||||||||
| Mutual Funds-5.0% | ||||||||
| 9,063,091 | Federated Hermes Government Obligations Fund, Premier Class, 7-Day Yield 5.279% (at net asset value) | 9,063,091 | ||||||
| TOTAL SHORT TERM INVESTMENTS | ||||||||
| (Cost $9,063,091) | 9,063,091 | |||||||
| TOTAL INVESTMENTS-99.8% | ||||||||
| (Cost $193,556,239) | 182,241,552 | |||||||
| OTHER ASSETS AND LIABILITIES-NET(3)-0.2% | 310,926 | |||||||
| NET ASSETS-100.0% | $ | 182,552,478 | ||||||
Investment Abbreviations:
LIBOR – London Interbank Offered Rate
| Annual Report | December 31, 2023 | |
39 |
Portfolio of Investments
| WesMark Government Bond Fund | December 31, 2023 |
Reference Rates:
1D US SOFR – 1 Day SOFR as of December 31, 2023 was 5.31%
1M SOFR – 1 Month SOFR as of December 31, 2023 was 5.35%
| (1) | Floating or variable rate security. The reference rate is described above. The Rate in effect as of December 31, 2023 is based on the reference rate plus the displayed spread as of the security’s last reset date. Certain variable rate securities are not based on a published reference rate and spread but are determined by the issuer or agent and are based on current market conditions. These securities do not indicate a reference rate and spread in their description above. |
| (3) | Assets, other than investments in securities, less liabilities. |
| Note | – | The categories of investments are shown as a percentage of net assets as of December 31, 2023. |
See Notes to Financial Statements which are an integral part of
the Financial Statements.
| 40 | |
www.wesmarkfunds.com |
Portfolio of Investments Summary Table
| December 31, 2023 (Unaudited) | WesMark West Virginia Municipal Bond Fund |
As of December 31, 2023, the Fund’s Portfolio Composition(1)
was as follows:
| Portfolio Composition | Percentage of Total Net Assets |
| NON-TAXABLE MUNICIPAL BONDS | 99.0% |
| SHORT TERM INVESTMENTS(2) | 0.5% |
| OTHER ASSETS AND LIABILITIES – NET(3) | 0.5% |
| TOTAL NET ASSETS | 100.0% |
| Years to Maturity of Municipal Bonds | Percentage of Total Net Assets |
| Less than 1 Year | 0.0% |
| 1-3 Years | 3.9% |
| 3-5 Years | 7.3% |
| 5-10 Years | 39.9% |
| 10 Years or Greater | 47.9% |
| Short Term Investments(2) | 0.5% |
| Other Assets and Liabilities – Net(3) | 0.5% |
| TOTAL | 100.0% |
| S&P Ratings of Municipal Bonds as Percentage of Total Net Assets(4) |
|
| AAA | 4.9% |
| AA | 91.5% |
| A | 0.6% |
| Not rated by S&P | 2.0% |
| Short Term Investments(2) | 0.5% |
| Other Assets and Liabilities – Net(3) | 0.5% |
| TOTAL PORTFOLIO VALUE | 100.0% |
Moody’s Ratings of Municipal Bonds as
Percentage of Total Net Assets(4)
| Aaa | 4.3% |
| Aa2 | 0.0% |
| Aa3 | 2.8% |
| A1 | 1.1% |
| A2 | 62.3% |
| Not rated by Moody’s | 28.5% |
| Short Term Investments(2) | 0.5% |
| Other Assets and Liabilities – Net(3) | 0.5% |
| TOTAL PORTFOLIO VALUE | 100.0% |
| (1) | See the Fund’s Prospectus and Statement of Additional Information for a description of the types of securities in which the Fund invests. |
| (2) | Short Term Investments include investment in a money market mutual fund. |
| (3) | Assets, other than investment in securities, less liabilities. See Statement of Assets and Liabilities. |
| (4) | These tables depict the long-term credit-quality ratings assigned to the Fund’s portfolio holdings by Standard & Poor’s (S&P) and Moody’s Investors Service (Moody’s), each of which is a Nationally Recognized Statistical Rating Organization (NRSRO). These credit-quality ratings are shown without regard to gradations within a given rating category. For example, securities rated “A-” have been included in the “A” rated category. Rated securities that have been prerefunded, but not rated again by the NRSRO, have been included in the “Not rated by…” category. |
Rated securities include a security with an
obligor and/or credit enhancer that has received a rating from an NRSRO with respect to a class of debt obligations that is comparable
in priority and security with the security held by the Fund. Credit-quality ratings are an assessment of the risk that a security will
default in payment and do not address other risks presented by the security. Please see the descriptions of credit-quality ratings in
the Fund’s Statement of Additional Information. Holdings that are rated only by a different NRSRO than the one identified have been
included in the “Not rated by…” category. Of the portfolio’s total investments, 15.25% do not have long-term
ratings by either of these NRSROs.
| Annual Report | December 31, 2023 | |
41 |
| Portfolio of Investments | |
| WesMark West Virginia Municipal Bond Fund | December 31, 2023 |
| Shares/Principal Amount | Value | |||||||
| NON-TAXABLE MUNICIPAL BONDS-99.0% | ||||||||
| West Virginia-99.0% | ||||||||
| $ | 1,000,000 | Berkeley County Board of Education, 4.000%, 6/1/2037 | $ | 1,059,906 | ||||
| Berkeley County Building Commission: | ||||||||
| 580,000 | 2.000%, 6/1/2035 | 482,174 | ||||||
| 750,000 | 2.000%, 6/1/2040 | 539,452 | ||||||
| 400,000 | 4.000%, 6/1/2040 | 406,171 | ||||||
| 1,500,000 | Berkeley County Public Service Sewer District, 4.500%, 10/1/2032 | 1,500,636 | ||||||
| Berkeley County, West Virginia, Public Service District Revenue Bonds: | ||||||||
| 370,000 | Series C, 3.000%, 12/1/2029 | 365,187 | ||||||
| 450,000 | Series C, 3.400%, 12/1/2034 | 440,946 | ||||||
| 585,000 | Series D, 3.000%, 12/1/2025 | 585,975 | ||||||
| 380,000 | Berkeley County, West Virginia, Public Service District Water Revenue Bonds, Series A, 4.500%, 12/1/2033 | 380,397 | ||||||
| Berkeley County, West Virginia, Public Service Sewer District Revenue Bonds: | ||||||||
| 275,000 | 5.000%, 6/1/2027 | 288,884 | ||||||
| 950,000 | 5.000%, 6/1/2028 | 998,189 | ||||||
| 655,000 | 5.000%, 6/1/2029 | 687,756 | ||||||
| 620,000 | Series A, 5.300%, 3/1/2029 | 621,487 | ||||||
| 950,000 | Brooke County Building Commission, 3.000%, 12/1/2036 | 907,840 | ||||||
| 965,000 | Brooke County, West Virginia, Board of Education General Obligation Unlimited Bonds, 3.000%, 6/1/2027 | 959,665 | ||||||
| 2,000,000 | Cabell County Board of Education, 2.000%, 6/1/2033 | 1,751,237 | ||||||
| 265,000 | City of Buckhannon, West Virginia, Commercial Development Revenue Bonds, Series A, 3.700%, 12/1/2028 | 250,595 | ||||||
| 595,000 | City of Buckhannon, West Virginia, Waterworks Revenue Bonds, Series A, 4.000%, 3/1/2029 | 595,110 | ||||||
| City of Charles Town WV Waterworks & Sewerage System Revenue: | ||||||||
| 400,000 | 2.250%, 6/1/2035 | 336,771 | ||||||
| 315,000 | 3.000%, 6/1/2041 | 275,417 | ||||||
| Shares/Principal Amount | Value | |||||||
| City of Charles Town, West Virginia, Waterworks & Sewage System Revenue Bonds: | ||||||||
| $ | 620,000 | Series A, 4.000%, 3/1/2029 | $ | 636,793 | ||||
| 310,000 | Series B, 4.000%, 6/1/2031 | 318,194 | ||||||
| City of Charleston, West Virginia, Sewage System Revenue Bonds: | ||||||||
| 310,000 | 4.000%, 7/1/2031 | 317,337 | ||||||
| 275,000 | 4.000%, 7/1/2032 | 280,861 | ||||||
| 300,000 | City of Clarksburg WV Water Revenue, 2.000%, 6/1/2034 | 248,222 | ||||||
| City of Saint Albans, West Virginia, Combined Waterworks & Sewerage System Revenue Bonds: | ||||||||
| 170,000 | Series A, 4.250%, 6/1/2026 | 170,053 | ||||||
| 600,000 | Series B, 4.000%, 12/1/2027 | 600,117 | ||||||
| City of Wheeling WV Waterworks & Sewerage System Revenue: | ||||||||
| 500,000 | 4.000%, 6/1/2035 | 533,612 | ||||||
| 500,000 | 4.000%, 6/1/2036 | 529,937 | ||||||
| Claywood Park Public Service District WV Water Revenue: | ||||||||
| 950,000 | 3.000%, 11/1/2036 | 884,541 | ||||||
| 680,000 | 3.000%, 11/1/2041 | 577,990 | ||||||
| Claywood Park Public Service District, West Virginia, Water Revenue Bonds: | ||||||||
| 110,000 | Series C, 3.200%, 11/1/2029 | 109,171 | ||||||
| 225,000 | Series C, 3.400%, 11/1/2031 | 223,192 | ||||||
| 380,000 | Corporation of Shepherdstown, West Virginia, Water Revenue Bonds, 3.300%, 3/1/2032 | 376,446 | ||||||
| Fayette County Board of Education: | ||||||||
| 545,000 | 2.250%, 10/1/2030 | 490,684 | ||||||
| 500,000 | 2.000%, 10/1/2031 | 438,866 | ||||||
| 640,000 | 2.250%, 10/1/2032 | 562,426 | ||||||
| 565,000 | 2.500%, 10/1/2033 | 506,709 | ||||||
| 750,000 | Greenbrier County Public Service, Series A, 5.000%, 10/1/2037 | 844,027 | ||||||
| Hampshire County, West Virginia, Building Commission Revenue Bonds: | ||||||||
| 355,000 | Series A, 3.000%, 1/1/2029 | 332,265 | ||||||
| 380,000 | Series A, 3.000%, 1/1/2031 | 348,413 | ||||||
| 1,660,000 | Series A, 4.250%, 1/1/2035 | 1,669,189 | ||||||
| 2,265,000 | Hancock, WV, 3.250%, 5/1/2036(1)(2) | 2,252,848 | ||||||
| 42 | |
www.wesmarkfunds.com |
| Portfolio of Investments | |
| December 31, 2023 | WesMark West Virginia Municipal Bond Fund |
| Shares/Principal Amount | Value | |||||||
| $ | 1,000,000 | Harrison County Building Commission, 3.500%, 10/1/2035 | $ | 917,598 | ||||
| 3,000,000 | Jefferson County Board of Education, 2.000%, 6/1/2036 | 2,463,980 | ||||||
| 850,000 | Lewis County Building Commission, 4.750%, 2/1/2038 | 853,085 | ||||||
| 1,910,000 | Mason County Public Service District Water Revenue, 3.000%, 12/1/2036 | 1,825,042 | ||||||
| 2,320,000 | Monongalia County Building Commission, 2.000%, 2/1/2034 | 2,025,735 | ||||||
| Morgantown Utility Board, Inc.: | ||||||||
| 500,000 | 3.250%, 12/1/2032 | 503,810 | ||||||
| 500,000 | 4.000%, 12/1/2034 | 539,009 | ||||||
| 1,500,000 | 3.000%, 12/1/2040 | 1,346,612 | ||||||
| 1,430,000 | Morgantown, West Virginia, Combined Utility System Revenue Bonds, Series A, 3.500%, 12/1/2035 | 1,450,920 | ||||||
| 200,000 | Morgantown, West Virginia, Combined Utility System Revenue Bonds, Series A, 3.750%, 10/1/2032 | 199,999 | ||||||
| Morgantown, West Virginia, Utility Board Revenue Bonds: | ||||||||
| 1,000,000 | Series A, 4.000%, 12/1/2029 | 1,033,344 | ||||||
| 1,210,000 | Series A, 4.000%, 12/1/2030 | 1,247,606 | ||||||
| 1,000,000 | Series A, 4.000%, 12/1/2031 | 1,028,376 | ||||||
| 1,030,000 | Moundsville Building Commission, 4.000%, 8/1/2037 | 1,008,819 | ||||||
| Ohio County Board of Education: | ||||||||
| 3,000,000 | 3.000%, 6/1/2033 | 2,961,969 | ||||||
| 635,000 | 3.000%, 6/1/2034 | 625,230 | ||||||
| 500,000 | Putnam County Building Commission, 4.000%, 5/1/2037 | 528,003 | ||||||
| Putnam Public Service District: | ||||||||
| 1,000,000 | 4.000%, 12/1/2039 | 972,664 | ||||||
| 1,150,000 | 3.000%, 11/1/2040 | 1,033,819 | ||||||
| 1,000,000 | 3.000%, 4/1/2041 | 887,769 | ||||||
| 1,000,000 | 3.000%, 6/1/2041 | 888,611 | ||||||
| 1,000,000 | 3.625%, 12/1/2045 | 873,194 | ||||||
| 1,000,000 | Raleigh County Public Service District, 3.000%, 6/1/2037 | 946,631 | ||||||
| 880,000 | Salem, West Virginia Sewer Revenue Bonds, Series A, 4.000%, 12/1/2032 | 880,228 | ||||||
| State of West Virginia: | ||||||||
| 500,000 | 5.000%, 6/1/2033 | 551,018 | ||||||
| 500,000 | 5.000%, 6/1/2035 | 548,650 | ||||||
| Shares/Principal Amount | Value | |||||||
| $ | 1,000,000 | 5.000%, 12/1/2040 | $ | 1,073,833 | ||||
| 795,000 | Wayne County, West Virginia, Board of Education General Obligation Unlimited Bonds, 3.000%, 6/1/2026 | 795,687 | ||||||
| 500,000 | West Virginia Commissioner Of Highways Special Obligation Surface Transportation Improvements Bonds, Series A, 5.000%, 9/1/2029 | 540,382 | ||||||
| 670,000 | West Virginia Economic Development Authority Lease Revenue Bonds (Clarksburg Office Building), 3.500%, 6/1/2030 | 673,600 | ||||||
| 1,650,000 | West Virginia Economic Development Authority Lease Revenue Bonds (State Office Building & Parking Lot), Series A, 4.750%, 8/1/2029 | 1,652,217 | ||||||
| West Virginia Economic Development Authority Lease Revenue Bonds (State Office Building): | ||||||||
| 310,000 | Series C, 3.500%, 6/1/2030 | 311,666 | ||||||
| 600,000 | Series D, 3.250%, 6/1/2028 | 603,035 | ||||||
| 355,000 | Series D, 3.500%, 6/1/2030 | 356,908 | ||||||
| 1,000,000 | West Virginia Economic Development Authority Lottery Revenue Bonds, Series A, 5.000%, 7/1/2032 | 1,076,031 | ||||||
| 100,000 | West Virginia Higher Education Policy Commission, 4.000%, 4/1/2034 | 100,035 | ||||||
| West Virginia Higher Education Policy Commission Revenue Bonds (Higher Education Facilities): | ||||||||
| 1,730,000 | 5.000%, 7/1/2034 | 1,845,723 | ||||||
| 400,000 | Series B, 3.600%, 4/1/2027 | 400,087 | ||||||
| 1,000,000 | West Virginia Hospital Finance Authority Revenue Bonds (ARCs Improvement), Series D, 4.000%, 6/1/2029 | 1,021,793 | ||||||
| 585,000 | West Virginia Hospital Finance Authority Revenue Bonds (West Virginia University Health System), Series A, 3.375%, 6/1/2029 | 588,751 | ||||||
| West Virginia Housing Development Fund: | ||||||||
| 1,100,000 | 3.450%, 11/1/2030 | 1,102,996 | ||||||
| 500,000 | 2.000%, 11/1/2032 | 420,339 | ||||||
| 1,500,000 | 3.700%, 11/1/2032 | 1,502,755 | ||||||
| Annual Report | December 31, 2023 | |
43 |
| Portfolio of Investments | |
| WesMark West Virginia Municipal Bond Fund | December 31, 2023 |
| Shares/Principal Amount | Value | |||||||
| $ | 375,000 | 3.800%, 5/1/2034 | $ | 377,571 | ||||
| 500,000 | 3.375%, 11/1/2034 | 497,418 | ||||||
| 370,000 | 3.850%, 11/1/2034 | 372,012 | ||||||
| 500,000 | 4.375%, 5/1/2035 | 526,303 | ||||||
| 800,000 | 2.050%, 11/1/2035 | 688,474 | ||||||
| 575,000 | 3.800%, 11/1/2037 | 568,096 | ||||||
| 1,500,000 | 4.150%, 11/1/2038 | 1,556,390 | ||||||
| 1,000,000 | 4.150%, 11/1/2038 | 1,037,593 | ||||||
| 500,000 | 4.450%, 11/1/2043 | 510,427 | ||||||
| West Virginia School Building Authority Lottery Revenue Capital Improvement Bonds: | ||||||||
| 515,000 | Series A, 5.000%, 7/1/2026 | 515,742 | ||||||
| 535,000 | Series A, 5.000%, 7/1/2027 | 535,759 | ||||||
| 300,000 | West Virginia State Bonds, Series A, 3.250%, 6/1/2033 | 301,141 | ||||||
| 500,000 | West Virginia State Economic Development Authority Lottery Revenue Bonds, 3.000%, 6/15/2031 | 499,360 | ||||||
| 500,000 | West Virginia State Hospital Finance Authority Refunding West Virginia United Health System, Series A, 4.000%, 6/1/2034 | 505,024 | ||||||
| 500,000 | West Virginia State Housing Development Fund Revenue Bonds, Series A, 3.450%, 11/1/2033 | 500,742 | ||||||
| 770,000 | West Virginia State University Revenues Revenue Bonds, Series A, 5.250%, 4/1/2028 | 804,560 | ||||||
| 1,000,000 | West Virginia University, 4.000%, 10/1/2037 | 1,027,886 | ||||||
| 500,000 | West Virginia Water Development Authority, 4.000%, 10/1/2041 | 501,229 | ||||||
| 500,000 | West Virginia Water Development Authority Infrastructure Revenue Bonds, Series A, 5.000%, 10/1/2032 | 526,380 | ||||||
| 2,605,000 | West Virginia Water Development Authority Infrastructure Revenue Bonds (West Virginia Infrastructure Jobs Program), Series A, 5.000%, 10/1/2029 | 2,755,145 | ||||||
| Shares/Principal Amount | Value | |||||||
| West Virginia Water Development Authority Revenue Bonds (Loan Program II): | ||||||||
| $ | 650,000 | Series A-II, 5.000%, 11/1/2026 | $ | 692,482 | ||||
| 800,000 | Series A-II, 3.000%, 11/1/2027 | 803,301 | ||||||
| 300,000 | Series A-II, 3.125%, 11/1/2028 | 302,742 | ||||||
| 725,000 | Series B-II, 4.000%, 11/1/2025 | 725,589 | ||||||
| 250,000 | West Virginia Water Development Authority Revenue Bonds (Loan Program IV), Series A-IV, 5.000%, 11/1/2033 | 272,341 | ||||||
| 500,000 | West Virginia, State Parkways Authority Senior Turnpike Toll Revenue Bonds, 5.000%, 6/1/2033 | 550,579 | ||||||
| 1,000,000 | Wood County, West Virginia, Board of Education Public School General Obligation Unlimited Bonds, 3.000%, 6/1/2029 | 1,007,923 | ||||||
| 860,000 | Wood County, West Virginia, Building Commission Lease Revenue Bonds, 4.000%, 1/1/2032 | 795,852 | ||||||
| 88,651,308 | ||||||||
| TOTAL NON-TAXABLE MUNICIPAL BONDS | ||||||||
| (Cost $92,473,336) | 88,651,308 | |||||||
| SHORT TERM INVESTMENTS-0.5% | ||||||||
| Mutual Funds-0.5% | ||||||||
| 473,409 | Federated Hermes Government Obligations Fund, Premier Class, 7-Day Yield 5.279% (at net asset value) | 473,409 | ||||||
| TOTAL SHORT TERM INVESTMENTS | ||||||||
| (Cost $473,409) | 473,409 | |||||||
| TOTAL INVESTMENTS-99.5% | ||||||||
| (Cost $92,946,745) | 89,124,717 | |||||||
| OTHER ASSETS AND LIABILITIES-NET(3)-0.5% | 457,392 | |||||||
| NET ASSETS-100.0% | $ | 89,582,109 | ||||||
| 44 | |
www.wesmarkfunds.com |
| Portfolio of Investments | |
| December 31, 2023 | WesMark West Virginia Municipal Bond Fund |
| (1) | Floating or variable rate security. The reference rate is described above. The Rate in effect as of December 31, 2023 is based on the reference rate plus the displayed spread as of the security’s last reset date. |
| (2) | Security exempt from registration under rule 144A of the Securities Act of 1933. These securities may be resold in transactions exempt from registration, normally to qualified institutional buyers. As of December 31, 2023, these securities amounted to a value of $2,252,848 or 2.51% of net assets. These Securities have been determined to be liquid pursuant to procedures adopted by the board. |
| (3) | Assets, other than investments in securities, less liabilities. |
Note – The categories of investments are shown as
a percentage of net assets as of December 31, 2023.
See Notes to Financial Statements which are an integral part
of the Financial Statements.
| Annual Report | December 31, 2023 | |
45 |
| Portfolio of Investments Summary Table | |
| WesMark Tactical Opportunity Fund | December 31, 2023 (Unaudited) |
As of December 31, 2023, the Fund’s
Portfolio Composition(1) was as follows:
| Portfolio Composition | Percentage of Total Net Assets |
| EXCHANGE TRADED FUNDS (ETF) | 93.6% |
| SHORT TERM INVESTMENTS(2) | 6.3% |
| OTHER ASSETS AND LIABILITIES – NET(3) | 0.1% |
| TOTAL NET ASSETS | 100.0% |
As of December 31, 2023, the Fund’s Category
composition(4) was as follows:
| Category Composition | Percentage of Total Net Assets |
| Broad Domestic Fixed Income | 42.2% |
| U.S. Sector Focused Equity | 12.2% |
| U.S. Value Company Focused Equity | 10.3% |
| Broad Domestic Equity | 9.9% |
| Commodities | 8.7% |
| U.S. Small and Mid Cap Equity | 7.1% |
| International (ex. U.S.) Equity | 3.2% |
| ETF Portfolio Sub-Total | 93.6% |
| Short Term Investments(2) | 6.3% |
| Other Assets and Liabilities – Net(3) | 0.1% |
| Total Net Assets | 100.0% |
| (1) | See the Fund’s Prospectus and Statement of Additional Information for a description of the types of securities in which the Fund invests. |
| (2) | Short Term Investments include investment in a money market mutual fund. |
| (3) | Assets, other than investments in securities, less liabilities. |
| (4) | Securities are assigned to a category classification by the Fund’s advisor. |
| 46 | |
www.wesmarkfunds.com |
| Portfolio of Investments | |
| December 31, 2023 | WesMark Tactical Opportunity Fund |
| Shares/Principal Amount | Value | |||||||
| EXCHANGE TRADED FUNDS-93.6% | ||||||||
| BROAD DOMESTIC EQUITY-9.9% | ||||||||
| 9,293 | SPDR S&P 500® ETF Trust | $ | 4,417,056 | |||||
| TOTAL BROAD DOMESTIC EQUITY | 4,417,056 | |||||||
| BROAD DOMESTIC FIXED INCOME-42.2% | ||||||||
| 47,058 | iShares® 1-3 Year Treasury Bond ETF | 3,860,638 | ||||||
| 27,601 | iShares® iBoxx $ High Yield Corporate Bond ETF | 2,136,042 | ||||||
| 59,038 | iShares® iBoxx $ Investment Grade Corporate Bond ETF | 6,533,145 | ||||||
| 63,952 | iShares® Core U.S. Aggregate Bond ETF | 6,347,236 | ||||||
| TOTAL BROAD DOMESTIC FIXED INCOME | 18,877,061 | |||||||
| COMMODITIES-8.7% | ||||||||
| 114,537 | Invesco Optimum Yield Diversified Commodity Strategy No K-1 ETF | 1,523,342 | ||||||
| 12,476 | SPDR® Gold Shares(1) | 2,385,037 | ||||||
| TOTAL COMMODITIES | 3,908,379 | |||||||
| INTERNATIONAL (EX. U.S.) EQUITY-3.2% | ||||||||
| 27,835 | iShares® MSCI ACWI ex U.S. ETF | 1,420,699 | ||||||
| TOTAL INTERNATIONAL (EX. U.S.) EQUITY | 1,420,699 | |||||||
| U.S. SECTOR FOCUSED EQUITY-12.2% | ||||||||
| 14,252 | Consumer Staples Select Sector SPDR® Fund | 1,026,571 | ||||||
| 12,894 | Energy Select Sector SPDR® Fund | 1,081,033 | ||||||
| 29,478 | Financial Select Sector SPDR® Fund | 1,108,373 | ||||||
| 7,906 | Health Care Select Sector SPDR® Fund | 1,078,220 | ||||||
| 10,326 | Industrial Select Sector SPDR® Fund | 1,177,061 | ||||||
| TOTAL U.S. SECTOR FOCUSED EQUITY | 5,471,258 | |||||||
| U.S. SMALL AND MID CAP EQUITY-7.1% | ||||||||
| 15,910 | iShares® Russell 2000® ETF | 3,193,296 | ||||||
| TOTAL U.S. SMALL AND MID CAP EQUITY | 3,193,296 | |||||||
| U.S. VALUE COMPANY FOCUSED EQUITY-10.3% | ||||||||
| 42,341 | Vanguard® Mega Cap Value ETF | 4,630,835 | ||||||
| Shares/Principal Amount | Value | |||||||
| TOTAL U.S. VALUE COMPANY FOCUSED EQUITY | $ | 4,630,835 | ||||||
| TOTAL EXCHANGE TRADED FUNDS | ||||||||
| (Cost $37,826,291) | 41,918,584 | |||||||
| SHORT TERM INVESTMENTS-6.3% | ||||||||
| Mutual Funds-6.3% | ||||||||
| 2,798,565 | Federated Hermes Government Obligations Fund, Premier Class, 7-Day Yield 5.279% (at net asset value) | 2,798,565 | ||||||
| TOTAL SHORT TERM INVESTMENTS | ||||||||
| (Cost $2,798,565) | 2,798,565 | |||||||
| TOTAL INVESTMENTS-99.9% | ||||||||
| (Cost $40,624,856) | 44,717,149 | |||||||
| OTHER ASSETS AND LIABILITIES-NET(2)-0.1% | 53,017 | |||||||
| NET ASSETS-100.0% | $ | 44,770,166 | ||||||
| (1) | Non-income producing security. |
| (2) | Assets, other than investments in securities, less liabilities. |
Note – The categories of investments are shown as a percentage
of net assets as of December 31, 2023.
Investment Abbreviations:
SPDR – Standard and Poor’s Depository Receipt
See Notes to Financial Statements which are an integral part of the
Financial Statements.
| Annual Report | December 31, 2023 | |
47 |
| Statements of Assets and Liabilities |
| December 31, 2023 |
| WesMark Small Company Fund | WesMark Large Company Fund | WesMark Balanced Fund | WesMark Government Bond Fund | WesMark West Virginia Municipal Bond Fund | WesMark Tactical Opportunity Fund | |||||||||||||||||||
| ASSETS: | ||||||||||||||||||||||||
| Investments in securities, at value (cost – see below) | $ | 110,171,172 | $ | 316,809,346 | $ | 98,172,295 | $ | 182,241,552 | $ | 89,124,717 | $ | 44,717,149 | ||||||||||||
| Cash | 28,602 | 124,964 | 7,463 | 12,250 | – | – | ||||||||||||||||||
| RECEIVABLE FOR: | ||||||||||||||||||||||||
| Dividends and interest | 74,551 | 160,746 | 443,281 | 1,009,287 | 663,655 | 28,617 | ||||||||||||||||||
| Fund shares sold | 82,319 | 10,304 | 18,891 | 74,385 | 18,902 | 52,000 | ||||||||||||||||||
| Prepaid expenses | 4,455 | 22,901 | 10,992 | 13,562 | 10,615 | 13,432 | ||||||||||||||||||
| Total Assets | 110,361,099 | 317,128,261 | 98,652,922 | 183,351,036 | 89,817,889 | 44,811,198 | ||||||||||||||||||
| LIABILITIES: | ||||||||||||||||||||||||
| PAYABLE FOR: | ||||||||||||||||||||||||
| Investments purchased | 649,943 | 2,746,868 | – | – | – | – | ||||||||||||||||||
| Fund shares redeemed | 3,508 | 43,873 | 477 | 184,149 | 809 | – | ||||||||||||||||||
| Income distribution payable | – | – | – | 551,691 | 181,891 | – | ||||||||||||||||||
| Fund Accounting and Administration fees | 19,387 | 34,043 | 22,459 | 31,311 | 24,186 | 13,639 | ||||||||||||||||||
| Audit, Tax, and Legal expenses | 18,846 | 18,846 | 18,846 | 18,846 | 18,846 | 18,846 | ||||||||||||||||||
| Shareholder services fee (Note 5) | 2,894 | 7,524 | 844 | 2,226 | 1,190 | 604 | ||||||||||||||||||
| Transfer agency expenses | 6,322 | 10,935 | 7,633 | 6,371 | 4,522 | 3,832 | ||||||||||||||||||
| Registration expenses | 210 | – | – | – | – | – | ||||||||||||||||||
| Printing and Postage expenses | 4,001 | 3,675 | 4,047 | 3,752 | 4,124 | 3,899 | ||||||||||||||||||
| Chief compliance officer fees | 212 | 212 | 212 | 212 | 212 | 212 | ||||||||||||||||||
| Other accrued liabilities and expenses | – | 1 | 100 | – | – | – | ||||||||||||||||||
| Total Liabilities | 705,323 | 2,865,977 | 54,618 | 798,558 | 235,780 | 41,032 | ||||||||||||||||||
| Net Assets | $ | 109,655,776 | $ | 314,262,284 | $ | 98,598,304 | $ | 182,552,478 | $ | 89,582,109 | $ | 44,770,166 | ||||||||||||
| NET ASSETS CONSIST OF: | ||||||||||||||||||||||||
| Paid-in capital | $ | 69,669,426 | $ | 123,216,357 | $ | 71,141,744 | $ | 230,843,855 | $ | 93,487,909 | $ | 42,294,503 | ||||||||||||
| Total distributable earnings (accumulated losses) | 39,986,350 | 191,045,927 | 27,456,560 | (48,291,377 | ) | (3,905,801 | ) | 2,475,663 | ||||||||||||||||
| Net Assets | $ | 109,655,776 | $ | 314,262,284 | $ | 98,598,304 | $ | 182,552,478 | $ | 89,582,108 | $ | 44,770,166 | ||||||||||||
| Shares Outstanding, No Par Value, Unlimited Shares Authorized | 8,313,341 | 14,531,870 | 7,499,394 | 22,989,620 | 9,064,558 | 4,066,738 | ||||||||||||||||||
| Net asset value, offering price & redemption price per share | $ | 13.19 | $ | 21.63 | $ | 13.15 | $ | 7.94 | $ | 9.88 | $ | 11.01 | ||||||||||||
| Investments, at identified cost | $ | 70,801,358 | $ | 137,196,761 | $ | 71,091,804 | $ | 193,556,239 | $ | 92,946,745 | $ | 40,624,856 | ||||||||||||
See Notes to Financial Statements which are an integral part of the
Financial Statements.
| 48 | |
www.wesmarkfunds.com |
| Statements of Operations |
| For the Year Ended December 31, 2023 |
| WesMark Small Company Fund | WesMark Large Company Fund | WesMark Balanced Fund | WesMark Government Bond Fund | WesMark West Virginia Municipal Bond Fund |
WesMark Tactical Opportunity Fund | |||||||||||||||||||
| INVESTMENT INCOME: | ||||||||||||||||||||||||
| Dividends, net of foreign taxes* | $ | 1,275,530 | $ | 4,394,316 | $ | 1,735,764 | $ | 139,928 | $ | – | $ | 1,109,380 | ||||||||||||
| Interest | 292,817 | 417,104 | 1,454,523 | 7,544,505 | 2,914,672 | 112,748 | ||||||||||||||||||
| Total Investment Income | 1,568,347 | 4,811,420 | 3,190,287 | 7,684,433 | 2,914,672 | 1,222,128 | ||||||||||||||||||
| EXPENSES: | ||||||||||||||||||||||||
| Investment adviser fee (Note 5) | 753,704 | 2,265,548 | 737,064 | 1,082,438 | 555,848 | 314,770 | ||||||||||||||||||
| Fund Accounting and | ||||||||||||||||||||||||
| Administration fees (Note 5) | 107,860 | 215,327 | 121,325 | 180,475 | 122,739 | 75,522 | ||||||||||||||||||
| Custodian fees (Note 5) | 19,633 | 38,278 | 17,347 | 26,584 | 15,732 | 10,609 | ||||||||||||||||||
| Transfer agency expenses (Note 5) | 29,896 | 47,903 | 35,834 | 29,710 | 22,718 | 19,992 | ||||||||||||||||||
| Trustees’ fees and expenses (Note 8) | 26,676 | 49,058 | 26,616 | 35,984 | 26,039 | 20,250 | ||||||||||||||||||
| Audit and tax expenses | 12,923 | 11,951 | 12,923 | 12,923 | 12,923 | 12,923 | ||||||||||||||||||
| Legal expenses | 14,497 | 14,497 | 14,497 | 14,497 | 30,313 | 14,497 | ||||||||||||||||||
| Shareholder services fee (Note 5) | 230,177 | 689,279 | 224,214 | 411,556 | 213,080 | 96,291 | ||||||||||||||||||
| Registration expenses | 11,086 | 8,524 | 9,483 | 9,538 | 5,084 | 7,790 | ||||||||||||||||||
| Printing and Postage expenses | 8,388 | 10,738 | 8,872 | 8,897 | 6,464 | 6,190 | ||||||||||||||||||
| Insurance premiums | 5,294 | 16,597 | 5,435 | 10,519 | 5,158 | 2,248 | ||||||||||||||||||
| Miscellaneous fees | 3,595 | 11,080 | 3,658 | 6,663 | 3,354 | 1,484 | ||||||||||||||||||
| Expenses | 1,223,729 | 3,378,780 | 1,217,268 | 1,829,784 | 1,019,452 | 582,566 | ||||||||||||||||||
| Net Investment Income | 344,618 | 1,432,640 | 1,973,019 | 5,854,649 | 1,895,220 | 639,562 | ||||||||||||||||||
| REALIZED & UNREALIZED GAIN (LOSS) ON INVESTMENTS: | ||||||||||||||||||||||||
| Net realized gain (loss) on investments | 6,643,343 | 33,482,556 | 2,404,833 | (19,936,600 | ) | (84,646 | ) | (179,528 | ) | |||||||||||||||
| Net change in unrealized appreciation (depreciation) of investments | 11,456,677 | 25,550,732 | 373,808 | 18,708,493 | 2,106,308 | 2,456,577 | ||||||||||||||||||
| Net realized and unrealized gain (loss) on investments | 18,100,020 | 59,026,001 | 2,778,154 | (1,228,107 | ) | 2,021,662 | 2,277,049 | |||||||||||||||||
| Net Increase in Net Assets Resulting from Operations | $ | 18,444,638 | $ | 60,465,928 | $ | 4,751,660 | $ | 4,626,542 | $ | 3,916,882 | $ | 2,916,611 | ||||||||||||
| *Foreign tax withholding | $ | – | $ | 31,645 | $ | – | $ | – | $ | – | $ | – | ||||||||||||
See Notes to Financial Statements which are an integral part of the
Financial Statements.
| Annual Report | December 31, 2023 | |
49 |
| Statements of Changes in Net Assets |
| WesMark Small Company Fund | WesMark Large Company Fund | |||||||||||||||
| For the Year Ended December 31, 2023 | For the Year Ended December 31, 2022 | For the Year Ended December 31, 2023 | For the Year Ended December 31, 2022 | |||||||||||||
| INCREASE (DECREASE) IN NET ASSETS FROM: | ||||||||||||||||
| OPERATIONS | ||||||||||||||||
| Net investment income (loss) | $ | 344,618 | $ | (45,024 | ) | $ | 1,432,640 | $ | 1,093,149 | |||||||
| Net realized gain | 6,643,343 | 1,351,070 | 33,482,556 | 25,054,442 | ||||||||||||
| Net change in unrealized appreciation (depreciation) | 11,456,677 | (25,939,505 | ) | 25,550,732 | (111,212,475 | ) | ||||||||||
| Net increase (decrease) in net assets resulting from operations | 18,444,638 | (24,633,459 | ) | 60,465,928 | (85,064,884 | ) | ||||||||||
| DISTRIBUTIONS TO SHAREHOLDERS (NOTE 4) | ||||||||||||||||
| From distributable earnings | (6,371,428 | ) | (5,747,960 | ) | (23,307,125 | ) | (34,280,806 | ) | ||||||||
| From tax return of capital | – | – | – | (206,360 | ) | |||||||||||
| Decrease in net assets from distributions to shareholders | (6,371,428 | ) | (5,747,960 | ) | (23,307,125 | ) | (34,487,166 | ) | ||||||||
| BENEFICIAL INTEREST TRANSACTIONS (NOTE 3) | ||||||||||||||||
| Proceeds from sale of shares | 11,594,119 | 14,506,618 | 13,465,804 | 26,967,402 | ||||||||||||
| Shares issued in reinvestment of distributions | 1,234,669 | 1,264,805 | 6,769,137 | 9,666,123 | ||||||||||||
| Cost of shares redeemed | (10,172,347 | ) | (10,200,963 | ) | (31,760,296 | ) | (31,225,912 | ) | ||||||||
| Net increase (decrease) resulting from beneficial interest transactions | 2,656,441 | 5,570,461 | (11,525,355 | ) | 5,407,613 | |||||||||||
| Net Increase (Decrease) in Net Assets | 14,729,651 | (24,810,959 | ) | 25,633,448 | (114,144,437 | ) | ||||||||||
| NET ASSETS: | ||||||||||||||||
| Beginning of Year | 94,926,125 | 119,737,084 | 288,628,836 | 402,773,273 | ||||||||||||
| End of Year | $ | 109,655,776 | $ | 94,926,125 | $ | 314,262,284 | $ | 288,628,836 | ||||||||
See Notes to Financial Statements which are an integral part of the
Financial Statements.
| 50 | |
www.wesmarkfunds.com |
| Statements of Changes in Net Assets |
| WesMark Balanced Fund | WesMark Government Bond Fund | |||||||||||||||
| For the Year Ended December 31, 2023 | For the Year Ended December 31, 2022 | For the Year Ended December 31, 2023 | For the Year Ended December 31, 2022 | |||||||||||||
| INCREASE (DECREASE) IN NET ASSETS FROM: | ||||||||||||||||
| OPERATIONS | ||||||||||||||||
| Net investment income | $ | 1,973,109 | $ | 1,472,965 | $ | 5,854,649 | $ | 3,203,653 | ||||||||
| Net realized gain (loss) | 2,404,833 | 948,209 | (19,936,600 | ) | (13,548,640 | ) | ||||||||||
| Net change in unrealized appreciation (depreciation) | 373,808 | (10,951,819 | ) | 18,708,493 | (30,213,726 | ) | ||||||||||
| Net increase (decrease) in net assets resulting from operations | 4,751,660 | (8,530,645 | ) | 4,626,542 | (40,558,713 | ) | ||||||||||
| DISTRIBUTIONS TO SHAREHOLDERS (NOTE 4) | ||||||||||||||||
| From distributable earnings | (4,637,257 | ) | (3,806,929 | ) | (5,960,206 | ) | (3,641,903 | ) | ||||||||
| Decrease in net assets from distributions to shareholders | (4,637,257 | ) | (3,806,929 | ) | (5,960,206 | ) | (3,641,903 | ) | ||||||||
| BENEFICIAL INTEREST TRANSACTIONS (NOTE 3) | ||||||||||||||||
| Proceeds from sale of shares | 10,122,385 | 6,615,483 | 22,244,916 | 20,202,558 | ||||||||||||
| Shares issued in reinvestment of distributions | 757,350 | 663,944 | 446,257 | 295,564 | ||||||||||||
| Cost of shares redeemed | (11,866,048 | ) | (17,324,069 | ) | (26,306,097 | ) | (31,529,222 | ) | ||||||||
| Net decrease resulting from beneficial interest transactions | (986,313 | ) | (10,044,643 | ) | (3,614,924 | ) | (11,031,100 | ) | ||||||||
| Net Decrease in Net Assets | (871,910 | ) | (22,382,216 | ) | (4,948,588 | ) | (55,231,716 | ) | ||||||||
| NET ASSETS: | ||||||||||||||||
| Beginning of Year | 99,470,214 | 121,852,431 | 187,501,066 | 242,732,782 | ||||||||||||
| End of Year | $ | 98,598,304 | $ | 99,470,215 | $ | 182,552,478 | $ | 187,501,066 | ||||||||
See Notes to Financial Statements which are an integral part of the
Financial Statements.
| Annual Report | December 31, 2023 | |
51 |
| Statements of Changes in Net Assets |
| WesMark West Virginia Municipal Bond Fund | WesMark Tactical Opportunity Fund | |||||||||||||||
| For the Year Ended December 31, 2023 | For the Year Ended December 31, 2022 | For the Year Ended December 31, 2023 | For the Year Ended December 31, 2022 | |||||||||||||
| INCREASE (DECREASE) IN NET ASSETS FROM: | ||||||||||||||||
| OPERATIONS | ||||||||||||||||
| Net investment income | $ | 1,895,220 | $ | 1,864,450 | $ | 639,562 | $ | 563,799 | ||||||||
| Net realized gain (loss) | (84,646 | ) | 9,879 | (179,528 | ) | (1,782,542 | ) | |||||||||
| Net change in unrealized appreciation (depreciation) | 2,106,308 | (10,726,622 | ) | 2,456,577 | (4,791,263 | ) | ||||||||||
| Net increase (decrease) in net assets resulting from operations | 3,916,882 | (8,852,293 | ) | 2,916,611 | (6,010,006 | ) | ||||||||||
| DISTRIBUTIONS TO SHAREHOLDERS (NOTE 4) | ||||||||||||||||
| From distributable earnings | (1,894,987 | ) | (1,873,967 | ) | (362,269 | ) | (1,148,896 | ) | ||||||||
| Decrease in net assets from distributions to shareholders | (1,894,987 | ) | (1,873,967 | ) | (362,269 | ) | (1,148,896 | ) | ||||||||
| BENEFICIAL INTEREST TRANSACTIONS (NOTE 3) | ||||||||||||||||
| Proceeds from sale of shares | 4,305,299 | 4,643,330 | 5,018,229 | 4,455,499 | ||||||||||||
| Shares issued in reinvestment of distributions | 234,375 | 254,666 | 4,362 | 15,188 | ||||||||||||
| Cost of shares redeemed | (12,576,715 | ) | (13,272,479 | ) | (3,938,959 | ) | (4,158,682 | ) | ||||||||
| Net increase (decrease) resulting from beneficial interest transactions | (8,037,041 | ) | (8,374,483 | ) | 1,083,632 | 312,004 | ||||||||||
| Net Increase (Decrease) in Net Assets | (6,015,146 | ) | (19,100,743 | ) | 3,637,974 | (6,846,897 | ) | |||||||||
| NET ASSETS: | ||||||||||||||||
| Beginning of Year | 95,597,255 | 114,697,998 | 41,132,192 | 47,979,089 | ||||||||||||
| End of Year | $ | 89,582,109 | $ | 95,597,255 | $ | 44,770,166 | $ | 41,132,192 | ||||||||
See Notes to Financial Statements which are an integral part of the
Financial Statements.
| 52 | |
www.wesmarkfunds.com |
| Financial Highlights |
| WesMark Small Company Fund |
| For the Year Ended December 31, 2023 | For the Year Ended December 31, 2022 | For the Year Ended December 31, 2021 | For the Year Ended December 31, 2020 | For the Year Ended December 31, 2019 | ||||||||||||||||
| PER COMMON SHARE OPERATING PERFORMANCE | ||||||||||||||||||||
| Net Asset Value, Beginning of Year | $ | 11.71 | $ | 15.66 | $ | 16.12 | $ | 12.79 | $ | 10.63 | ||||||||||
| Income (Loss) from Investment Operations: | ||||||||||||||||||||
| Net Investment Income (Loss) | 0.06 | 0.00 | (1) | (0.07 | ) | (1.36 | ) | (0.05 | ) | |||||||||||
| Net Realized and Unrealized Gain (Loss) on Investments | 2.20 | (3.22 | ) | 3.64 | 6.01 | 2.21 | ||||||||||||||
| Total from Investment Operations | 2.26 | (3.22 | ) | 3.57 | 4.65 | 2.16 | ||||||||||||||
| LESS DISTRIBUTIONS TO COMMON SHAREHOLDERS | ||||||||||||||||||||
| From Net Investment Income | (0.04 | ) | – | – | – | – | ||||||||||||||
| From Net Realized Gain on Investments | (0.74 | ) | (0.73 | ) | (4.03 | ) | (1.32 | ) | – | |||||||||||
| Total Distributions | (0.78 | ) | 0.73 | (4.03 | ) | (1.32 | ) | – | ||||||||||||
| Net Asset Value, End of Year | $ | 13.19 | $ | 11.71 | $ | 15.66 | $ | 16.12 | $ | 12.79 | ||||||||||
| Total Return | 19.46 | % | (20.56 | )% | 23.23 | % | 36.61 | % | 20.32 | % | ||||||||||
| RATIOS TO AVERAGE NET ASSETS | ||||||||||||||||||||
| Net Expenses | 1.22 | % | 1.24 | % | 1.23 | % | 1.27 | % | 1.26 | % | ||||||||||
| Net Investment Income/(Loss) | 0.34 | % | (0.04 | )% | (0.47 | )% | (0.37 | )% | (0.46 | )% | ||||||||||
| Net Assets Value End of Year (000 omitted) | $ | 109,656 | $ | 94,926 | $ | 119,737 | $ | 116,105 | $ | 96,185 | ||||||||||
| Portfolio Turnover Rate | 48 | % | 52 | % | 42 | % | 52 | % | 50 | % | ||||||||||
| (1) | Less than $0.005 per share. |
See Notes to Financial Statements which are an integral part
of the Financial Statements.
| Annual Report | December 31, 2023 | |
53 |
| Financial Highlights |
| WesMark Large Company Fund |
| For the Year Ended December 31, 2023 | For the Year Ended December 31, 2022 | For the Year Ended December 31, 2021 | For the Year Ended December 31, 2020 | For the Year Ended December 31, 2019 | ||||||||||||||||
| PER COMMON SHARE OPERATING PERFORMANCE | ||||||||||||||||||||
| Net Asset Value, Beginning of Year | $ | 19.12 | $ | 27.41 | $ | 23.41 | $ | 19.95 | $ | 16.80 | ||||||||||
| Income (Loss) from Investment Operations: | ||||||||||||||||||||
| Net Investment Income (Loss) | 0.11 | 0.09 | (0.02 | ) | (1.66 | ) | 0.04 | |||||||||||||
| Net Realized and Unrealized Gain (Loss) on Investments | 4.06 | (5.93 | ) | 6.08 | 6.89 | 4.40 | ||||||||||||||
| Total from Investment Operations | 4.17 | (5.84 | ) | 6.06 | 5.23 | 4.44 | ||||||||||||||
| LESS DISTRIBUTIONS TO COMMON SHAREHOLDERS | ||||||||||||||||||||
| From Net Investment Income | (0.10 | ) | (0.09 | ) | (0.00 | )(1) | (0.02 | ) | (0.04 | ) | ||||||||||
| From Net Realized Gain on Investments | (1.56 | ) | (2.35 | ) | (2.06 | ) | (1.75 | ) | (1.25 | ) | ||||||||||
| From Tax Return of Capital | – | (0.01 | ) | – | – | – | ||||||||||||||
| Total Distributions | (1.66 | ) | (2.45 | ) | (2.06 | ) | (1.77 | ) | (1.29 | ) | ||||||||||
| Net Asset Value, End of Year | $ | 21.63 | $ | 19.12 | $ | 27.41 | $ | 23.41 | $ | 19.95 | ||||||||||
| Total Return | 21.94 | % | (21.42 | )% | 26.06 | % | 26.31 | % | 26.53 | % | ||||||||||
| RATIOS TO AVERAGE NET ASSETS | ||||||||||||||||||||
| Net Expenses | 1.12 | % | 1.13 | % | 1.12 | % | 1.14 | % | 1.14 | % | ||||||||||
| Net Investment Income/(Loss) | 0.48 | % | 0.33 | % | (0.09 | )% | 0.07 | % | 0.23 | % | ||||||||||
| Net Assets Value End of Year (000 omitted) | $ | 314,262 | $ | 288,629 | $ | 402,773 | $ | 364,086 | $ | 331,238 | ||||||||||
| Portfolio Turnover Rate | 24 | % | 34 | % | 14 | % | 27 | % | 55 | % | ||||||||||
| (1) | Less than $0.005 per share. |
See Notes to Financial Statements which are an integral part
of the Financial Statements.
| 54 | |
www.wesmarkfunds.com |
| Financial Highlights |
| WesMark Balanced Fund |
| For the Year Ended December 31, 2023 | For the Year Ended December 31, 2022 | For the Year Ended December 31, 2021 | For the Year Ended December 31, 2020 | For the Year Ended December 31, 2019 | ||||||||||||||||
| PER COMMON SHARE OPERATING PERFORMANCE | ||||||||||||||||||||
| Net Asset Value, Beginning of Year | $ | 13.13 | $ | 14.68 | $ | 13.45 | $ | 13.31 | $ | 11.77 | ||||||||||
| Income (Loss) from Investment Operations: | ||||||||||||||||||||
| Net Investment Income (Loss) | 0.27 | 0.19 | 0.16 | (0.08 | ) | 0.23 | ||||||||||||||
| Net Realized and Unrealized Gain (Loss) on Investments | 0.37 | (1.24 | ) | 1.96 | 0.72 | 2.14 | ||||||||||||||
| Total from Investment Operations | 0.64 | (1.05 | ) | 2.12 | 0.64 | 2.37 | ||||||||||||||
| LESS DISTRIBUTIONS TO COMMON SHAREHOLDERS | ||||||||||||||||||||
| From Net Investment Income | (0.27 | ) | (0.22 | ) | (0.17 | ) | (0.22 | ) | (0.23 | ) | ||||||||||
| From Net Realized Gain on Investments | (0.35 | ) | (0.28 | ) | (0.72 | ) | (0.28 | ) | (0.60 | ) | ||||||||||
| Total Distributions | (0.62 | ) | (0.50 | ) | (0.89 | ) | (0.50 | ) | (0.83 | ) | ||||||||||
| Net Asset Value, End of Year | $ | 13.15 | $ | 13.13 | $ | 14.68 | $ | 13.45 | $ | 13.31 | ||||||||||
| Total Return | 4.98 | % | (7.19 | )% | 15.85 | % | 5.05 | % | 20.30 | % | ||||||||||
| RATIOS TO AVERAGE NET ASSETS | ||||||||||||||||||||
| Net Expenses | 1.24 | % | 1.24 | % | 1.25 | % | 1.27 | % | 1.25 | % | ||||||||||
| Net Investment Income | 2.01 | % | 1.36 | % | 1.03 | % | 1.66 | % | 1.74 | % | ||||||||||
| Net Assets Value End of Year (000 omitted) | $ | 98,598 | $ | 99,470 | $ | 121,852 | $ | 114,766 | $ | 112,171 | ||||||||||
| Portfolio Turnover Rate | 24 | % | 18 | % | 23 | % | 29 | % | 31 | % | ||||||||||
See Notes to Financial Statements which are an integral part of the
Financial Statements.
| Annual Report | December 31, 2023 | |
55 |
| Financial Highlights |
| WesMark Government Bond Fund |
| For the Year Ended December 31, 2023 | For the Year Ended December 31, 2022 | For the Year Ended December 31, 2021 | For the Year Ended December 31, 2020 | For the Year Ended December 31, 2019 | ||||||||||||||||
| PER COMMON SHARE OPERATING PERFORMANCE | ||||||||||||||||||||
| Net Asset Value, Beginning of Year | $ | 7.99 | $ | 9.81 | $ | 10.08 | $ | 9.93 | $ | 9.68 | ||||||||||
| Income (Loss) from Investment Operations: | ||||||||||||||||||||
| Net Investment Income | 0.25 | 0.13 | 0.07 | 0.11 | 0.19 | |||||||||||||||
| Net Realized and Unrealized Gain (Loss) on Investments | (0.04 | ) | (1.80 | ) | (0.21 | ) | 0.23 | 0.27 | ||||||||||||
| Total from Investment Operations | 0.21 | (1.67 | ) | (0.14 | ) | 0.34 | 0.46 | |||||||||||||
| LESS DISTRIBUTIONS TO COMMON SHAREHOLDERS | ||||||||||||||||||||
| From Net Investment Income | (0.26 | ) | (0.15 | ) | (0.13 | ) | (0.19 | ) | (0.21 | ) | ||||||||||
| Total Distributions | (0.26 | ) | (0.15 | ) | (0.13 | ) | (0.19 | ) | (0.21 | ) | ||||||||||
| Net Asset Value, End of Year | $ | 7.94 | $ | 7.99 | $ | 9.81 | $ | 10.08 | $ | 9.93 | ||||||||||
| Total Return | 2.71 | % | (17.11 | )% | (1.35 | )% | 3.46 | % | 4.75 | % | ||||||||||
| RATIOS TO AVERAGE NET ASSETS | ||||||||||||||||||||
| Net Expenses | 1.01 | % | 1.01 | % | 1.02 | % | 1.03 | % | 1.01 | % | ||||||||||
| Net Investment Income | 3.24 | % | 1.51 | % | 0.72 | % | 1.09 | % | 1.72 | % | ||||||||||
| Net Assets Value End of Year (000 omitted) | $ | 182,552 | $ | 187,501 | $ | 242,733 | $ | 232,565 | $ | 231,959 | ||||||||||
| Portfolio Turnover Rate | 72 | % | 56 | % | 40 | % | 51 | % | 37 | % | ||||||||||
See Notes to Financial Statements which are an integral part of the
Financial Statements.
| 56 | |
www.wesmarkfunds.com |
| Financial Highlights |
| WesMark West Virginia Municipal Bond Fund |
| For the Year Ended December 31, 2023 | For the Year Ended December 31, 2022 | For the Year Ended December 31, 2021 | For the Year Ended December 31, 2020 | For the Year Ended December 31, 2019 | ||||||||||||||||
| PER COMMON SHARE OPERATING PERFORMANCE | ||||||||||||||||||||
| Net Asset Value, Beginning of Year | $ | 9.67 | $ | 10.69 | $ | 10.84 | $ | 10.67 | $ | 10.38 | ||||||||||
| Income (Loss) from Investment Operations: | ||||||||||||||||||||
| Net Investment Income | 0.20 | 0.18 | 0.17 | 0.18 | 0.20 | |||||||||||||||
| Net Realized and Unrealized Gain (Loss) on Investments | 0.21 | (1.02 | ) | (0.13 | ) | 0.18 | 0.30 | |||||||||||||
| Total from Investment Operations | 0.41 | (0.84 | ) | 0.04 | 0.36 | 0.50 | ||||||||||||||
| LESS DISTRIBUTIONS TO COMMON SHAREHOLDERS | ||||||||||||||||||||
| From Net Investment Income | (0.20 | ) | (0.18 | ) | (0.17 | ) | (0.19 | ) | (0.21 | ) | ||||||||||
| From Net Realized Gain on Investments | – | (0.00 | )(1) | (0.02 | ) | (0.00 | )(1) | (0.00 | )(1) | |||||||||||
| Total Distributions | (0.20 | ) | (0.18 | ) | (0.19 | ) | (0.19 | ) | (0.21 | ) | ||||||||||
| Net Asset Value, End of Year | $ | 9.88 | $ | 9.67 | $ | 10.69 | $ | 10.84 | $ | 10.67 | ||||||||||
| Total Return | 4.29 | % | (7.84 | )% | 0.43 | % | 3.48 | % | 4.83 | % | ||||||||||
| RATIOS TO AVERAGE NET ASSETS | ||||||||||||||||||||
| Net Expenses | 1.10 | % | 1.10 | % | 1.11 | % | 1.10 | % | 1.08 | % | ||||||||||
| Net Investment Income | 2.05 | % | 1.84 | % | 1.61 | % | 1.81 | % | 1.94 | % | ||||||||||
| Net Assets Value End of Year (000 omitted) | $ | 89,582 | $ | 95,597 | $ | 114,698 | $ | 119,454 | $ | 117,868 | ||||||||||
| Portfolio Turnover Rate | 6 | % | 9 | % | 15 | % | 10 | % | 9 | % | ||||||||||
| (1) | Less than $0.005 per share. |
See Notes to Financial Statements which are an integral part
of the Financial Statements.
| Annual Report | December 31, 2023 | |
57 |
| Financial Highlights |
| WesMark Tactical Opportunity Fund |
| For the Year Ended December 31, 2023 | For the Year Ended December 31, 2022 | For the Year Ended December 31, 2021 | For the Year Ended December 31, 2020 | For the Year Ended December 31, 2019 | ||||||||||||||||
| PER COMMON SHARE OPERATING PERFORMANCE | ||||||||||||||||||||
| Net Asset Value, Beginning of Year | $ | 10.37 | $ | 12.16 | $ | 11.95 | $ | 11.25 | $ | 10.01 | ||||||||||
| Income (Loss) from Investment Operations: | ||||||||||||||||||||
| Net Investment Income | 0.16 | 0.14 | 0.19 | 0.04 | 0.10 | |||||||||||||||
| Net Realized and Unrealized Gain (Loss) on Investments | 0.57 | (1.64 | ) | 1.45 | 0.91 | 1.56 | ||||||||||||||
| Total from Investment Operations | 0.73 | (1.50 | ) | 1.64 | 0.95 | 1.66 | ||||||||||||||
| LESS DISTRIBUTIONS TO COMMON SHAREHOLDERS | ||||||||||||||||||||
| From Net Investment Income | (0.09 | ) | (0.02 | ) | (0.13 | ) | (0.04 | ) | (0.11 | ) | ||||||||||
| From Net Realized Gain on Investments | – | (0.07 | ) | (1.30 | ) | (0.21 | ) | (0.31 | ) | |||||||||||
| Total Distributions | (0.09 | ) | (0.29 | ) | (1.43 | ) | (0.25 | ) | (0.42 | ) | ||||||||||
| Net Asset Value, End of Year | $ | 11.01 | $ | 10.37 | $ | 12.16 | $ | 11.95 | $ | 11.25 | ||||||||||
| Total Return | 7.10 | % | (12.38 | )% | 13.94 | % | 8.48 | % | 16.61 | % | ||||||||||
| RATIOS TO AVERAGE NET ASSETS | ||||||||||||||||||||
| Net Expenses(1) | 1.39 | % | 1.43 | % | 1.44 | % | 1.50 | % | 1.46 | % | ||||||||||
| Net Investment Income(1)(2) | 1.52 | % | 1.29 | % | 1.45 | % | 0.36 | % | 0.91 | % | ||||||||||
| Net Assets Value End of Year (000 omitted) | $ | 44,770 | $ | 41,132 | $ | 47,979 | $ | 45,762 | $ | 41,452 | ||||||||||
| Portfolio Turnover Rate | 39 | % | 85 | % | 78 | % | 169 | % | 152 | % | ||||||||||
| (1) | The ratios shown do not include the Fund’s proportionate shares of the expenses of the underlying investment companies in which the Fund invests. |
| (2) | Recognition of net investment income is affected by the timing and declaration of dividends by the underlying investment companies in which the Fund invests. |
See Notes to Financial Statements which are an integral part of the
Financial Statements.–
| 58 | |
www.wesmarkfunds.com |
| Notes to Financial Statements |
| December 31, 2023 |
1. ORGANIZATION
WesMark Funds (the “Trust”) is
registered under the Investment Company Act of 1940, as amended (the “Act”), as an open-end management investment company.
The Trust consists of six portfolios (individually referred to as the “Fund”, or collectively as the “Funds”),
which are presented herein:
| Portfolio Name | Diversification | Investment Objective |
| WesMark Small Company Fund (“Small Company Fund”) | Diversified | To achieve capital appreciation |
| WesMark Large Company Fund (“Large Company Fund”) | Diversified | To achieve capital appreciation |
| WesMark Balanced Fund (“Balanced Fund”) | Diversified | To achieve capital appreciation and income |
| WesMark Government Bond Fund (“Government Bond Fund”) | Diversified | To achieve high current income consistent with preservation of capital |
| WesMark West Virginia Municipal Bond Fund (“West Virginia Municipal Bond Fund”) | Non-diversified | To achieve current income which is exempt from federal income tax and income taxes imposed by the State of West Virginia |
| WesMark Tactical Opportunity Fund (“Tactical Opportunity Fund”) | Diversified | To achieve capital appreciation |
The assets of each Fund are segregated and a shareholder’s interest
is limited to the Fund in which shares are held.
2. SIGNIFICANT ACCOUNTING POLICIES
The following is a summary of significant accounting
policies consistently followed by the Funds in the preparation of their financial statements. These policies are in conformity with generally
accepted accounting principles (“GAAP”) in the United States of America.
The accompanying financial statements were prepared
in accordance with GAAP in the United States, which require the use of estimates made by management of the Funds. Actual results could
differ from those estimates that affect the reported amounts of assets and liabilities and disclosure of contingent assets and liabilities
at the date of the financial statements and the reported amounts of increases and decreases in net assets from operations during the reporting
period. Each Fund is an investment company and accordingly follows the investment company accounting and reporting guidance of the Financial
Accounting Standards Board (FASB) Accounting Standard Codifications Topic 946 Financial Services – Investment Companies.
Investment Valuation – In calculating their net asset value
(NAV), the Funds generally value investments as follows:
| ›› | Equity securities listed on an exchange or traded through a regulated market system are valued at their last reported sale price or official closing price on their principal exchange or market. |
| ›› | Fixed-income securities acquired with remaining maturities greater than 60 days are valued using price evaluations provided by a pricing service approved by the Board of Trustees (the “Trustees”). |
| ›› | Fixed-income securities acquired with remaining maturities of 60 days or less may be valued using price evaluations provided by a pricing service approved by the Trustees. They may also be valued at their cost (adjusted for the accretion of any discount or amortization of any premium), which approximates value. |
| ›› | Options are generally valued at market values established by the exchanges on which they are traded at the close of trading on such exchanges. |
| ›› | Shares of other mutual funds are valued based upon their reported NAVs. |
If the Funds cannot obtain a price or price evaluation
from a pricing service for an investment, the Funds may attempt to value the investment based upon the mean of bid and asked quotations
or fair value the investment based on price evaluations, from one or more dealers. If any price, quotation, price evaluation or other
pricing source is not readily available when the NAV is calculated, the Funds use the fair value of the investment determined in accordance
with the procedures described below. There can be no assurance that the Funds could purchase or sell an investment at the price used to
calculate the Funds’ NAVs.
| Annual Report | December 31, 2023 | |
59 |
| Notes to Financial Statements |
| December 31, 2023 |
Fair Valuation and Significant Events Procedures
– The Trustees have authorized the use of pricing services to provide evaluations of the current fair value of certain investments
for purposes of calculating the NAV. Factors considered by pricing services in evaluating an investment include the yields or prices of
investments of comparable quality, coupon, maturity, call rights and other potential prepayments, terms and type, reported transactions,
indications as to values from dealers, and general market conditions. The Funds normally use mean evaluations (a price evaluation indicative
of a price between the bid and asked prices for an investment) for fixed-income securities. In the event that market quotations and price
evaluations are not available for an investment, the fair value of the investment is determined in accordance with procedures adopted
by the Trustees.
The Trustees also have adopted procedures requiring
an investment to be priced at its fair value whenever the Adviser determines that a significant event affecting the value of the investment
has occurred between the time as of which the price of the investment would otherwise be determined and the time as of which the NAV is
computed. An event is considered significant if there is both an affirmative expectation that the investment’s value will change
in response to the event and a reasonable basis for quantifying the resulting change in value. Examples of significant events that may
occur after the close of the principal market on which a security is traded, or after the time of a price evaluation provided by a pricing
service or a dealer, include:
| ›› | With respect to securities traded in foreign markets, significant trends in U.S. equity markets or in the trading of foreign securities index futures or options contracts; |
| ›› | With respect to price evaluations of fixed-income securities determined before the close of regular trading on the NYSE, actions by the Federal Reserve Open Market Committee and other significant trends in U.S. fixed-income markets; and |
| ›› | Corporate announcements concerning matters such as acquisitions, recapitalizations, litigation developments, a natural disaster affecting the issuer’s operations or regulatory changes or market developments affecting the issuer’s industry. |
The Funds may seek to obtain more current quotations
or price evaluations from alternative pricing sources. If a reliable alternative pricing source is not available, the Funds will determine
the fair value of the investment using another method approved by the Trustees.
A three-tier hierarchy has been established to maximize
the use of observable market data and minimize the use of unobservable inputs and to establish classification of fair value measurements
for disclosure purposes. Inputs refer broadly to the assumptions that market participants would use in pricing the asset or liability,
including assumptions about risk, for example, the risk inherent in a particular valuation approach used to measure fair value including
such a pricing model and/or the risk inherent in the inputs to the valuation approach. Observable inputs are inputs that reflect the assumptions
market participants would use in pricing the asset or liability developed based on market data obtained from sources independent of the
reporting entity. Unobservable inputs are inputs that reflect the reporting entity’s own assumptions about the assumptions market
participants would use in pricing the asset or liability developed based on the best information available in the circumstances.
The three-tier hierarchy of inputs is summarized in the three broad Levels
listed below.
| Level 1 — | Unadjusted quoted prices in active markets for identical assets or liabilities that the Funds have the ability to access at the measurement date. |
| Level 2 — | Observable inputs other than quoted prices included in Level 1 that are observable for the asset or liability either directly or indirectly. These inputs may include quoted prices for the identical instrument on an inactive market, prices for similar instruments, interest rates, prepayment speeds, credit risk, yield curves, default rates and similar data. |
| Level 3 — | Unobservable inputs for the asset or liability, to the extent relevant observable inputs are not available, representing the Funds’ own assumptions about the assumptions a market participant would use in valuing the asset or liability, and would be based on the best information available. |
| 60 | |
www.wesmarkfunds.com |
| Notes to Financial Statements |
| December 31, 2023 |
The following is a summary of the inputs used as of December 31, 2023 in
valuing the Funds’ investments carried at fair value:
Small Company Fund
| Investments in Securities at Value* | Level 1 – Quoted Prices | Level 2 – Other Significant Observable Inputs | Level 3 – Significant Unobservable Inputs | Total | ||||||||||||
| Common Stocks | $ | 106,684,730 | $ | – | $ | – | $ | 106,684,730 | ||||||||
| Exchange Traded Funds | 2,216,527 | – | – | 2,216,527 | ||||||||||||
| Short Term Investments | 1,269,915 | – | – | 1,269,915 | ||||||||||||
| Total | $ | 110,171,172 | $ | – | $ | – | $ | 110,171,172 | ||||||||
Large Company Fund
| Investments in Securities at Value* | Level 1 – Quoted Prices | Level 2 – Other Significant Observable Inputs | Level 3 – Significant Unobservable Inputs | Total | ||||||||||||
| Common Stocks | $ | 308,725,943 | $ | – | $ | – | $ | 308,725,943 | ||||||||
| Short Term Investments | 8,083,403 | – | – | 8,083,403 | ||||||||||||
| Total | $ | 316,809,346 | $ | – | $ | – | $ | 316,809,346 | ||||||||
Balanced Fund
| Investments in Securities at Value* | Level 1 – Quoted Prices | Level 2 – Other Significant Observable Inputs | Level 3 – Significant Unobservable Inputs | Total | ||||||||||||
| Common Stocks | $ | 59,367,129 | $ | – | $ | – | $ | 59,367,129 | ||||||||
| Corporate Bonds | – | 24,787,879 | – | 24,787,879 | ||||||||||||
| U.S. Government Agency – Collateralized Mortgage Obligations | – | 547,034 | – | 547,034 | ||||||||||||
| Commercial Mortgage-Backed Securities | – | 1,444,561 | – | 1,444,561 | ||||||||||||
| U.S. Government Agency – Mortgage-Backed Securities | – | 3,020,299 | – | 3,020,299 | ||||||||||||
| U.S. Treasury Securities | – | 6,098,937 | – | 6,098,937 | ||||||||||||
| Taxable Municipal Bonds | – | 2,419,981 | – | 2,419,981 | ||||||||||||
| Short Term Investments | 486,475 | – | – | 486,475 | ||||||||||||
| Total | $ | 59,853,604 | $ | 38,318,691 | $ | – | $ | 98,172,295 | ||||||||
| Annual Report | December 31, 2023 | |
61 |
| Notes to Financial Statements |
| December 31, 2023 |
Government Bond Fund
| Investments in Securities at Value* | Level 1 – Quoted Prices | Level 2 – Other Significant Observable Inputs | Level 3 – Significant Unobservable Inputs | Total | ||||||||||||
| Exchange Traded Funds | $ | 3,655,776 | $ | – | $ | – | $ | 3,655,776 | ||||||||
| Corporate Bonds | – | 14,676,939 | – | 14,676,939 | ||||||||||||
| U.S. Government Agency – Collateralized Mortgage Obligations | – | 39,676,017 | – | 39,676,017 | ||||||||||||
| U.S. Government Agency – Mortgage-Backed Securities | – | 72,229,309 | – | 72,229,309 | ||||||||||||
| U.S. Treasury Securities | – | 29,925,236 | – | 29,925,236 | ||||||||||||
| Taxable Municipal Bonds | – | 13,015,184 | – | 13,015,184 | ||||||||||||
| Short Term Investments | 9,063,091 | – | – | 9,063,091 | ||||||||||||
| Total | $ | 12,718,867 | $ | 169,522,685 | $ | – | $ | 182,241,552 | ||||||||
West Virginia Municipal Bond Fund
| Investments in Securities at Value* | Level 1 – Quoted Prices | Level 2 – Other Significant Observable Inputs | Level 3 – Significant Unobservable Inputs | Total | ||||||||||||
| Non-Taxable Municipal Bonds | $ | – | $ | 88,651,308 | $ | – | $ | 88,651,308 | ||||||||
| Short Term Investments | 473,409 | – | – | 473,409 | ||||||||||||
| Total | $ | 473,409 | $ | 88,651,308 | $ | – | $ | 89,124,717 | ||||||||
Tactical Opportunity Fund
| Investments in Securities at Value* | Level 1 – Quoted Prices | Level 2 – Other Significant Observable Inputs | Level 3 – Significant Unobservable Inputs | Total | ||||||||||||
| Exchange Traded Funds | $ | 41,918,584 | $ | – | $ | – | $ | 41,918,584 | ||||||||
| Short Term Investments | 2,798,565 | – | – | 2,798,565 | ||||||||||||
| Total | $ | 44,717,149 | $ | – | $ | – | $ | 44,717,149 | ||||||||
All securities of the Funds were valued using either Level 1 or Level
2 inputs during the year ended December 31, 2023. Thus, a reconciliation of assets in which unobservable inputs (Level 3) were used is
not applicable for the Funds.
| * | For detailed descriptions of sector and/or geography classifications, see the accompanying Portfolios of Investments. |
Investment Income, Expenses and Distributions –
Investment transactions are accounted for on a trade-date basis. Realized gains and losses from investment transactions are recorded on
an identified cost basis. Interest income and expenses are accrued daily. Dividend income and distributions to shareholders are recorded
on the ex-dividend date. Non-cash dividends included in dividend income, if any, are recorded at fair value. Foreign dividends are recorded
on the ex-dividend date or when the Funds are informed of the ex-dividend date. Trust level expenses are allocated to each Fund based
on net assets, equally across all Funds, or to a specific Fund, whichever is deemed most appropriate for a particular expense. Each Fund
pays its own expenses.
Distributions of net investment income, if any, for
the Small Company Fund, Large Company Fund, and Tactical Opportunity Fund are declared and paid quarterly. Distributions of net investment
income for the Balanced Fund are declared and paid monthly, and distributions of net investment income for the Government Bond Fund and
West Virginia Municipal Bond Fund are declared daily and paid monthly. Distributions of capital gains, if any, for Small Company Fund,
Large Company Fund, Balanced Fund, Government Bond Fund, West Virginia Municipal Bond Fund, and Tactical Opportunity Fund are declared
and paid annually.
| 62 | |
www.wesmarkfunds.com |
| Notes to Financial Statements |
| December 31, 2023 |
Premium and Discount Amortization/Paydown Gains
and Losses – All premiums and discounts on fixed-income securities are amortized/accreted over the estimated lives of such securities
for financial statement purposes using the effective interest method. Gains and losses realized on principal payments of mortgage-backed
securities (paydown gains and losses) are classified as part of investment income.
Federal Taxes – It is each Fund’s
policy to comply with the Subchapter M provision of the Internal Revenue Code of 1986, as amended, (the “Code”) and to distribute
to shareholders each year substantially all of its income. As of and during the year ended December 31, 2023, the Funds did not have a
liability for any unrecognized tax benefits. The Funds recognize interest and penalties, if any, related to tax liabilities as income
tax expense in the Statements of Operations. The Funds file U.S. federal, state, and local tax returns as required. The Funds’ tax
returns are subject to examination by the relevant tax authorities until expiration of the applicable statute of limitations which is
generally three years after the filing of the tax return for federal purposes and four years for most state returns. Tax returns for open
years have not incorporated uncertain tax positions that require a provision for income taxes and federal and state taxing authorities.
The Funds may be subject to taxes imposed by governments
of countries in which they invest. Such taxes are generally based on either income or gains earned or repatriated. The Funds accrue and
apply such taxes to net investment income, net realized gains and net unrealized gains as income is earned.
Withholding taxes on foreign dividends have been provided
for in accordance with the Funds’ understanding of the applicable country’s tax rules and rates.
When-Issued and Delayed Delivery Transactions –
The Funds may engage in when-issued or delayed delivery transactions. The Funds record when-issued securities on the trade date and maintain
security positions such that sufficient liquid assets will be available to make payment for the securities purchased. Securities purchased
on a when-issued or delayed delivery basis are marked to market daily and begin earning interest on the settlement date. Losses may occur
on these transactions due to changes in market conditions or the failure of counterparties to perform under the contract.
Restricted Securities – Restricted securities
are securities that either: (a) cannot be offered for public sale without first being registered, or being able to take advantage of an
exemption from registration, under the Securities Act of 1933; or (b) are subject to contractual restrictions on public sales. In some
cases, when a security cannot be offered for public sale without first being registered, the issuer of the restricted security has agreed
to register such securities for resale, at the issuer’s expense, either upon demand by the Funds or in connection with another registered
offering of the securities. Many such restricted securities may be resold in the secondary market in transactions exempt from registration.
Restricted securities may be determined to be liquid under criteria established by the Trustees. The Funds will not incur any registration
costs upon such resales. The Funds’ restricted securities are valued at the price provided by dealers in the secondary market or,
if no market prices are available, at the fair value as determined in accordance with procedures established by and under the general
supervision of the Trustees.
Derivative Instruments and Hedging Activities – The following
discloses the Funds’ use of derivative instruments and hedging activities.
The Funds’ exposure to derivative contracts
and hybrid instruments, either directly or indirectly through another investment company, may involve risks different from or possibly
greater than the risk associated with investing directly in a security instead of the derivative. Risks include: 1) the value of the derivative
may not correlate with the value of the underlying security or may correlate inversely; 2) any potential risk reduction may be offset
with gain limitations; 3) derivatives may be difficult to price; 4) possible adverse tax consequences; and 5) other risks, such as but
not limited to, stock market, interest rate, credit, currency, liquidity, and leverage risks.
Market Risk Factors: In pursuit of their investment
objectives, certain Funds may use derivatives that increase or decrease a Fund’s exposure to the following market risk factors:
Equity Risk: Equity risk relates to the change in value of equity
securities as they relate to increases or decreases in the general market.
Interest Rate Risk: Changes in interest rates
will affect the value of a Fund’s investments. In general, as interest rates rise, bond prices fall, and as interest rates fall,
bond prices rise. Interest rate risk is generally greater for funds that invest a significant portion of their assets in high yield securities.
Writing Covered Call Options and Purchasing Put Options
The Funds will not write call options on securities
unless the securities are held in the Fund’s portfolio or unless the Fund is entitled to them in deliverable forms without further
payment or after segregating cash in the amount of any further payment.
The Funds will not purchase put options on securities unless the securities
are held in the Fund’s portfolio.
| Annual Report | December 31, 2023 | |
63 |
| Notes to Financial Statements |
| December 31, 2023 |
Option contracts (options) – are rights to buy or
sell a security for a specified price within a specified period. The seller of the option receives a payment, or premium, from the buyer,
which the seller keeps regardless of whether the buyer uses (or exercises) the option. Options can trade on exchanges or in the over the
counter (OTC) market and may be bought or sold on a wide variety of securities. There were no options held as of or for the year ended
December 31, 2023.
A Fund may buy and/or sell the following types of options:
Call Options – A call option gives the
holder (buyer) the right to buy the underlying security from the seller (writer) of the option. A Fund may use call options in the following
ways:
| ›› | Buy call options on a security in anticipation of an increase in the value of the security; or |
| ›› | Sell call options on a security to generate income from premiums, and in anticipation of a decrease or only limited increase in the value of the underlying security. If a Fund writes a call option on a security that it owns and that call option is exercised, a Fund must deliver the security to the buyer and foregoes any possible profit from an increase in the market price of the security over the exercise price plus the premium received. |
Put Options – A put option gives the holder the right to sell
the security to the writer of the option. A Fund may use put options in the following ways:
| ›› | Buy put options on a security in anticipation of a decrease in the value of the security; or |
| ›› | Write put options on a security to generate income from premiums, and in anticipation of an increase or only limited decrease in the value of the security. In writing puts, there is a risk that a Fund may be required to take delivery of the security when its current market price is lower than the exercise price. |
A Fund may also buy or write options, as needed, to
close out existing option positions. Finally, a Fund may enter into combinations of options contracts in an attempt to benefit from changes
in the prices of those options contracts (without regard to changes in the value of the security).
Market Risk – The Funds may incur losses
due to political, regulatory, market, economic or social developments affecting the market(s) generally. Local, regional or global events
such as terrorism, war, natural disasters, disease/virus outbreaks and epidemics or other public health crises, recessions, depressions
or other events – or the potential for such events – could have a significant negative impact on economic and market conditions.
| 64 | |
www.wesmarkfunds.com |
| Notes to Financial Statements |
| December 31, 2023 |
3. SHARES OF BENEFICIAL INTEREST
The following tables summarize share activity:
| For the Year Ended December 31, 2023 | For the Year Ended December 31, 2022 | |||||||
| Small Company Fund | ||||||||
| Shares sold | 931,375 | 1,093,038 | ||||||
| Shares issued to shareholders in payment of distributions declared | 95,274 | 108,103 | ||||||
| Shares redeemed | (816,551 | ) | (746,313 | ) | ||||
| Net increase resulting from share transactions | 210,098 | 454,828 | ||||||
| Common shares outstanding, end of period | 8,313,341 | 8,103,243 | ||||||
| For the Year Ended December 31, 2023 | For the Year Ended December 31, 2022 | |||||||
| Large Company Fund | ||||||||
| Shares sold | 643,610 | 1,265,300 | ||||||
| Shares issued to shareholders in payment of distributions declared | 317,619 | 499,686 | ||||||
| Shares redeemed | (1,528,935 | ) | (1,360,580 | ) | ||||
| Net increase/(decrease) resulting from share transactions | (567,706 | ) | 404,406 | |||||
| Common shares outstanding, end of period | 14,531,870 | 15,099,576 | ||||||
| For the Year Ended December 31, 2023 | For the Year Ended December 31, 2022 | |||||||
| Balanced Fund | ||||||||
| Shares sold | 775,327 | 487,554 | ||||||
| Shares issued to shareholders in payment of distributions declared | 58,117 | 49,827 | ||||||
| Shares redeemed | (910,314 | ) | (1,261,719 | ) | ||||
| Net decrease resulting from share transactions | (76,870 | ) | (724,338 | ) | ||||
| Common shares outstanding, end of period | 7,499,394 | 7,576,264 | ||||||
| For the Year Ended December 31, 2023 | For the Year Ended December 31, 2022 | |||||||
| Government Bond Fund | ||||||||
| Shares sold | 2,843,550 | 20,202,558 | ||||||
| Shares issued to shareholders in payment of distributions declared | 57,071 | 34,517 | ||||||
| Shares redeemed | (3,368,684 | ) | (3,644,043 | ) | ||||
| Net increase/(decrease) resulting from share transactions | (468,063 | ) | 16,593,032 | |||||
| Common shares outstanding, end of period | 22,989,620 | 23,457,683 | ||||||
| Annual Report | December 31, 2023 | |
65 |
| Notes to Financial Statements |
| December 31, 2023 |
| For the Year Ended December 31, 2023 | For the Year Ended December 31, 2022 | |||||||
| West Virginia Municipal Bond Fund | ||||||||
| Shares sold | 452,772 | 467,846 | ||||||
| Shares issued to shareholders in payment of distributions declared | 24,390 | 25,998 | ||||||
| Shares redeemed | (1,297,883 | ) | (1,336,265 | ) | ||||
| Net decrease resulting from share transactions | (820,721 | ) | (842,421 | ) | ||||
| Common shares outstanding, end of period | 9,064,558 | 9,885,279 | ||||||
| For the Year Ended December 31, 2023 | For the Year Ended December 31, 2022 | |||||||
| Tactical Opportunity Fund | ||||||||
| Shares sold | 474,685 | 403,019 | ||||||
| Shares issued to shareholders in payment of distributions declared | 417 | 1,427 | ||||||
| Shares redeemed | (373,408 | ) | (384,362 | ) | ||||
| Net increase resulting from share transactions | 101,694 | 20,084 | ||||||
| Common shares outstanding, end of period | 4,066,738 | 3,965,044 | ||||||
4. FEDERAL TAX INFORMATION AND TAX BASIS
The timing and character of income and capital gain
distributions are determined in accordance with income tax regulations, which may differ from GAAP. These differences were primarily attributable
to non-deductible excise taxes paid. For the Funds’ most recent year ended December 31, 2023, permanent differences identified and
reclassified among the components of net assets were as follows:
| Fund Name | Paid-in Capital | Total Distributable earnings | ||||||
| Small Company Fund | $ | – | $ | – | ||||
| Large Company Fund | $ | – | $ | – | ||||
| Balanced Fund | $ | – | $ | – | ||||
| Government Bond Fund | $ | – | $ | – | ||||
| West Virginia Municipal Bond Fund | $ | (640 | ) | $ | 640 | |||
| Tactical Opportunity Fund | $ | – | $ | – | ||||
For federal income tax purposes, the following amounts apply as of December
31, 2023:
| Fund Name | Gross Appreciation (excess of value over tax cost) | Gross Depreciation (excess of tax cost over value) | Net Unrealized Appreciation (Depreciation) | Cost of Investments for Income Tax Purposes (includes cost of derivatives) | ||||||||||||
| Small Company Fund | $ | 41,001,328 | $ | (1,631,514 | ) | $ | 39,369,814 | $ | 70,801,358 | |||||||
| Large Company Fund | $ | 180,506,026 | $ | (1,046,601 | ) | $ | 179,459,425 | $ | 137,349,921 | |||||||
| Balanced Fund | $ | 28,325,687 | $ | (1,262,979 | ) | $ | 27,062,708 | $ | 71,109,587 | |||||||
| Government Bond Fund | $ | 683,615 | $ | (12,135,516 | ) | $ | (11,451,901 | ) | $ | 193,693,453 | ||||||
| West Virginia Municipal Bond Fund | $ | 564,927 | $ | (4,386,955 | ) | $ | (3,822,028 | ) | $ | 92,946,745 | ||||||
| Tactical Opportunity Fund | $ | 4,645,449 | $ | (543,815 | ) | $ | 4,101,634 | $ | 40,615,515 | |||||||
| 66 | |
www.wesmarkfunds.com |
| Notes to Financial Statements |
| December 31, 2023 |
The difference between book and tax basis for unrealized appreciation/(depreciation)
for the Funds is attributable to wash sales, deferred dividends, premium amortization accruals, and commodity grantor trusts.
| For Year Ended December 31, 2023 | ||||||||||||||||
| Fund Name | Tax-Exempt Income | Ordinary Income | Long-Term Capital Gain | Total | ||||||||||||
| Small Company Fund | $ | – | $ | 362,902 | $ | 6,008,526 | $ | 6,371,428 | ||||||||
| Large Company Fund | $ | – | $ | 1,427,369 | $ | 21,879,756 | $ | 23,307,125 | ||||||||
| Balanced Fund | $ | – | $ | 2,001,991 | $ | 2,635,266 | $ | 4,637,257 | ||||||||
| Government Bond Fund | $ | – | $ | 5,960,206 | $ | – | $ | 5,960,206 | ||||||||
| West Virginia Municipal Bond Fund | $ | 1,882,105 | $ | 12,882 | $ | – | $ | 1,894,987 | ||||||||
| Tactical Opportunity Fund | $ | – | $ | 362,269 | $ | – | $ | 362,269 | ||||||||
| For Year Ended December 31, 2022 | ||||||||||||||||||||
| Fund Name | Tax-Exempt Income | Ordinary Income | Long-Term Capital Gain | Return of Capital | Total | |||||||||||||||
| Small Company Fund | $ | – | $ | – | $ | 5,747,960 | $ | – | $ | 5,747,960 | ||||||||||
| Large Company Fund | $ | – | $ | 1,093,149 | $ | 33,187,657 | $ | 206,360 | $ | 34,487,166 | ||||||||||
| Balanced Fund | $ | – | $ | 1,684,615 | $ | 2,122,314 | $ | – | $ | 3,806,929 | ||||||||||
| Government Bond Fund | $ | – | $ | 3,641,903 | $ | – | $ | – | $ | 3,641,903 | ||||||||||
| West Virginia Municipal Bond Fund | $ | 1,862,599 | $ | 3,899 | $ | 7,469 | $ | – | $ | 1,873,967 | ||||||||||
| Tactical Opportunity Fund | $ | – | $ | 866,192 | $ | 282,704 | $ | – | $ | 1,148,896 | ||||||||||
As of December 31, 2023, the Funds’ most recent year
end, the components of distributable earnings on a tax basis was as follows:
| Fund Name | Undistributed net investment income | Undistributed tax-exempt income | Accumulated net realized gain (loss) on investments | Other cumulative effect of timing differences | Net unrealized appreciation (depreciation) on investments | Total | ||||||||||||||||||
| Small Company Fund | $ | 261,307 | $ | – | $ | 355,229 | $ | – | $ | 39,369,814 | $ | 39,986,350 | ||||||||||||
| Large Company Fund | $ | 5,271 | $ | – | $ | 11,581,231 | $ | – | $ | 179,459,425 | $ | 191,045,927 | ||||||||||||
| Balanced Fund | $ | – | $ | – | $ | 390,924 | $ | 2,928 | $ | 27,062,708 | $ | 27,456,560 | ||||||||||||
| Government Bond Fund | $ | 120,522 | $ | – | $ | (36,959,998 | ) | $ | – | $ | (11,451,901 | ) | $ | (48,291,377 | ) | |||||||||
| West Virginia Municipal Bond Fund | $ | 6 | $ | 867 | $ | (84,646 | ) | $ | – | $ | (3,822,028 | ) | $ | (3,905,801 | ) | |||||||||
| Tactical Opportunity Fund | $ | 322,503 | $ | – | $ | (1,948,474 | ) | $ | – | $ | 4,101,634 | $ | 2,475,663 | |||||||||||
Under current law, capital losses maintain their character
as short-term or long-term and are carried forward to the next tax year without expiration. As of December 31, 2023, the following amounts
are available as carry forwards to the next tax year:
| Non expiring | ||||||||
| Fund Name | ST | LT | ||||||
| Government Bond Fund | $ | 7,458,093 | $ | 29,501,905 | ||||
| West Virgina Municipal Bond Fund | $ | – | $ | 86,646 | ||||
| Tactical Opportunity Fund | $ | 1,693,878 | $ | 254,596 | ||||
| Annual Report | December 31, 2023 | |
67 |
| Notes to Financial Statements |
| December 31, 2023 |
5. INVESTMENT ADVISER FEE AND OTHER TRANSACTIONS WITH AFFILIATES
Investment Adviser Fee – WesBanco Investment
Department is the Funds’ investment adviser (the “Adviser”). The Advisory Agreement between the Funds and the Adviser
provides for an annual fee, accrued daily and paid monthly, equal to the percentage of each Fund’s average daily net assets as follows:
| Fund Name | Investment Adviser Fee Percentage | |||
| Small Company Fund | 0.75% | |||
| Large Company Fund | 0.75% | |||
| Balanced Fund | 0.75% | |||
| Government Bond Fund | 0.60% | |||
| West Virginia Municipal Bond Fund | 0.60% | |||
| Tactical Opportunity Fund | 0.75% | |||
The Adviser is contractually obligated to waive a
portion of its fees and reimburse other expenses until February 28, 2023 in amounts necessary to limit the Tactical Opportunity Fund’s
operating expenses (including the organizational expenses of the Fund, but excluding interest expense, fees on borrowings and expenses
associated with the Fund’s investment in other investment companies, if any, extraordinary expenses, tax reclaim recovery expenses
and proxy-related expenses) to an annual rate (as a percentage of the Fund’s average daily net assets) of 1.75%. This expense limitation
arrangement was not renewed upon its expiration on February 28, 2023. The Adviser is not entitled to recoup any of the fees or expenses
waived or reimbursed within this expense limitation arrangement.
For the year ended December 31, 2023, the Adviser did not waive any fees
due to expenses being under the limit.
Administrative Fee – ALPS Fund Services,
Inc. (“ALPS”) provides the Funds with certain administrative personnel and services. The fees paid to ALPS are based on the
daily average aggregate net assets of the Trust for the period, subject to an annual minimum (on the Trust level). The annual minimum
fee will be allocated among the Funds using an equal per-Fund allocation. Any remaining amounts of the minimum fee after the per-Fund
allocation will be allocated among the Funds based upon the relative net assets of each Fund.
Transfer Agent Fee – ALPS is the Transfer
Agent and Dividend Disbursing Agent for the Funds. ALPS receives an annual base fee per Fund in addition to certain out-of-pocket expenses.
Distribution (12b-1) Fee – ALPS Distributors,
Inc. (“ADI”), an affiliate of ALPS, serves as the Funds’ distributor. The Funds currently have no active distribution
plan pursuant to Rule 12b-1 under the Act.
Shareholder Services Fee – Under the
terms of Shareholder Services Agreements with WesBanco Bank (“WesBanco”, an affiliate of the Adviser) and other financial institutions,
the Funds may pay WesBanco as well as other financial institutions, up to 0.25% of average daily net assets. The fee is used to finance
certain services for shareholders and to maintain shareholder accounts. WesBanco and other financial institutions may voluntarily choose
to waive any portion of their fee, which arrangement they can modify or terminate at any time at their sole discretion.
Recordkeeping Fee – The Funds may pay
recordkeeping fees on an average net assets basis or on a per account per year basis to financial intermediaries for providing recordkeeping
services to the Funds and shareholders.
Custodian Fees – WesBanco is the Funds’
custodian. The custodian fee paid to WesBanco is based on the level of each Fund’s average daily net assets for the period, plus
out-of-pocket expenses. WesBanco may voluntarily choose to waive any portion of its fee. WesBanco can modify or terminate this voluntary
waiver at any time at its sole discretion.
General – Certain Officers and Trustees of the Funds are Officers
and Directors or Trustees of the above companies.
| 68 | |
www.wesmarkfunds.com |
| Notes to Financial Statements |
| December 31, 2023 |
6. INVESTMENT TRANSACTIONS
Purchases and sales of investments, excluding long-term
U.S. government securities and short-term obligations, for the year ended December 31, 2023 were as follows:
| Fund | Purchases | Sales | ||||||
| Small Company Fund | $ | 45,719,396 | $ | 46,725,645 | ||||
| Large Company Fund | 69,139,183 | 96,796,276 | ||||||
| Balanced Fund | 18,687,670 | 24,728,385 | ||||||
| Government Bond Fund | 82,417,971 | 110,790,301 | ||||||
| West Virginia Municipal Bond Fund | 5,779,170 | 13,721,100 | ||||||
| Tactical Opportunity Fund | 15,866,117 | 15,704,162 | ||||||
Purchases and Sales of U.S. Government Securities, other than short-term
securities, for the year ended December 31, 2023 were as follows:
| Fund | Purchases | Sales | ||||||
| Balanced Fund | $ | 3,924,854 | $ | 1,517,969 | ||||
| Government Bond Fund | 43,617,128 | 14,650,825 | ||||||
7. CONCENTRATION OF RISK
Since the West Virginia Municipal Bond Fund invests
a substantial portion of its assets in issuers located in one state, it is more susceptible to factors adversely affecting issuers of
that state than would be a comparable tax-exempt mutual fund that invests nationally. In order to reduce the credit risk associated with
such factors, as of December 31, 2023, 30% of the securities in the portfolio were backed by letters of credit, bond insurance of various
financial institutions, or financial guaranty assurance agencies.
Additionally, the Funds may invest a portion of their
assets in securities of companies that are deemed by the Funds’ management to be classified in similar business sectors. The economic
developments within a particular sector may have an adverse effect on the ability of issuers to meet their obligations. Additionally,
economic developments may have an effect on the liquidity and volatility of portfolio securities.
8. COMPENSATION OF TRUSTEES
None of the Trustees are entitled to receive any retirement,
pension plan or deferred compensation benefits from the Trust. Interested Trustees receive the same compensation as Independent Trustees.
No officers of the Funds are compensated by the Funds, but officers may be reimbursed by the Funds for travel and related expenses incurred
in performing their duties.
9. RECENT ACCOUNTING PRONOUNCEMENT
In March 2020, the FASB issued Accounting Standards
Update (“ASU”) No. 2020-04, “Reference Rate Reform (Topic 848): Facilitation of the Effects of Reference Rate Reform
on Financial Reporting.” ASU 2020-04 provides optional guidance to ease the potential accounting burden due to the discontinuation
of the LIBOR and other interbank-offered based reference rates. ASU 2020-04 is effective as of March 12, 2020 and can be applied through
December 31, 2022. Management is currently evaluating the impact, if any, of applying ASU 2020-04. FASB has deferred the sunset date to
December 31,2024. At this time, management believes the adoption of ASU 2020-04 will not have a material impact to the financial statements.
| Annual Report | December 31, 2023 | |
69 |
| Notes to Financial Statements |
| December 31, 2023 |
10. SUBSEQUENT EVENTS
In preparing these financial statements, the Funds’
management has evaluated events and transactions for potential recognition or disclosure through the date the financial statements were
issued.
Shareholder Distributions for the Balanced Fund: On
January 31, 2024, the Balanced Fund paid a monthly distribution of $0.03115 per share to common shareholders of record as of January 24,
2024.
Shareholder Distributions for Government Bond Fund
and West Virginia Municipal Bond Fund: On Febraury 1, 2024, the Government Bond Fund and the West Virginia Municipal Bond Fund paid daily
distributions declared from January 1, 2024 to January 31, 2024 totaling $0.01976 and $0.01495 per share, respectively, to common shareholders.
| 70 | |
www.wesmarkfunds.com |
| Report of Independent Registered Public Accounting Firm |
To the Shareholders and Board of Trustees of
WesMark Funds
Opinion on the Financial Statements
We have audited the accompanying statements of
assets and liabilities, including the portfolios of investments, of WesMark Funds comprising WesMark Small Company Fund, WesMark Large
Company Fund, WesMark Balanced Fund, WesMark Government Bond Fund, WesMark West Virginia Municipal Bond Fund, and WesMark Tactical Opportunity
Fund (the “Funds”) as of December 31, 2023, the related statements of operations for the year then ended, the statements of
changes in net assets for each of the two years in the period then ended, the related notes, and the financial highlights for each of
the five years in the period then ended (collectively referred to as the “financial statements”). In our opinion, the financial
statements present fairly, in all material respects, the financial position of each of the Funds as of December 31, 2023, the results
of their operations, the changes in net assets, and the financial highlights for the periods indicated above, in conformity with accounting
principles generally accepted in the United States of America.
Basis for Opinion
These financial statements are the responsibility
of the Funds’ management. Our responsibility is to express an opinion on the Funds’ financial statements based on our audits.
We are a public accounting firm registered with the Public Company Accounting Oversight Board (United States) (“PCAOB”) and
are required to be independent with respect to the Funds in accordance with the U.S. federal securities laws and the applicable rules
and regulations of the Securities and Exchange Commission and the PCAOB.
We conducted our audits in accordance with the
standards of the PCAOB. Those standards require that we plan and perform the audit to obtain reasonable assurance about whether the financial
statements are free of material misstatement whether due to error or fraud.
Our audits included performing procedures to assess
the risks of material misstatement of the financial statements, whether due to error or fraud, and performing procedures that respond
to those risks. Such procedures included examining, on a test basis, evidence regarding the amounts and disclosures in the financial statements.
Our procedures included confirmation of securities owned as of December 31, 2023, by correspondence with the custodian and brokers; when
replies were not received from brokers, we performed other auditing procedures. Our audits also included evaluating the accounting principles
used and significant estimates made by management, as well as evaluating the overall presentation of the financial statements. We believe
that our audits provide a reasonable basis for our opinion.
We have served as the Funds’ auditor since
2011.

COHEN & COMPANY, LTD.
Cleveland, Ohio
February 26, 2024
| Annual Report | December 31, 2023 | |
71 |
| Shareholder Expense Example |
| December 31, 2023 (Unaudited) |
As a shareholder of a Fund, you incur ongoing costs,
including managdement fees and to the extent applicable, shareholder services fees and other Fund expenses. This example is intended to
help you to understand your ongoing costs (in dollars) of investing in the Funds and to compare these costs with the ongoing costs of
investing in other mutual funds. It is based on an investment of $1,000 invested at the beginning of the period and held for the entire
period from July 1, 2023 to December 31, 2023.
ACTUAL EXPENSES
The first line of the table below (“Actual Fund
Return”) provides information about actual account values and actual expenses. You may use the information in this section, together
with the amount you invested, to estimate the expenses that you incurred over the period. Simply divide your account value by $1,000 (for
example, an $8,600 account value divided by $1,000 = 8.6), then multiply the result by the number in the first section under the heading
“Expense Paid During Period” to estimate the expenses attributable to your investment during this period.
HYPOTHETICAL EXAMPLE FOR COMPARISON PURPOSES
The second line under each fund of the table below
(“Hypothetical Fund Return”) provides information about hypothetical account values and hypothetical expenses based on a Fund’s
actual expense ratio and an assumed rate of return of 5% per year before expenses, which is not the Fund’s actual return. Thus,
you should not use the hypothetical account values and expenses to estimate the actual ending account balance or your expenses for the
period. Rather, these figures are required to be provided to enable you to compare the ongoing costs of investing in the Funds with other
funds. To do so, compare this 5% hypothetical example with the 5% hypothetical examples that appear in the shareholder reports of the
other funds.
Please note that the expenses shown in the table are
meant to highlight your ongoing costs only. Therefore, the second line of the table below (“Hypothetical Fund Return”) is
useful in comparing ongoing costs only and will not help you determine the relative total costs of owning different funds.
| Beginning Account Value July 1, 2023 | Ending Account Value December 31, 2023 | Expense Paid During Period(1) | Net Expense Ratios(2) | |||||||||||||
| WesMark Small Company Fund | ||||||||||||||||
| Actual Fund Return | $ | 1,000.00 | $ | 1,120.40 | $ | 6.52 | 1.22 | % | ||||||||
| Hypothetical Fund Return (assuming a 5% return before expenses) | $ | 1,000.00 | $ | 1,019.06 | $ | 6.21 | 1.22 | % | ||||||||
| WesMark Balanced Fund | ||||||||||||||||
| Actual Fund Return | $ | 1,000.00 | $ | 1,038.30 | $ | 6.42 | 1.25 | % | ||||||||
| Hypothetical Fund Return (assuming a 5% return before expenses) | $ | 1,000.00 | $ | 1,018.90 | $ | 6.36 | 1.25 | % | ||||||||
| WesMark Government Bond Fund | ||||||||||||||||
| Actual Fund Return | $ | 1,000.00 | $ | 1,025.10 | $ | 5.26 | 1.03 | % | ||||||||
| Hypothetical Fund Return (assuming a 5% return before expenses) | $ | 1,000.00 | $ | 1,020.01 | $ | 5.24 | 1.03 | % | ||||||||
| WesMark West Virginia Municipal Bond Fund | ||||||||||||||||
| Actual Fund Return | $ | 1,000.00 | $ | 1,030.70 | $ | 5.68 | 1.11 | % | ||||||||
| Hypothetical Fund Return (assuming a 5% return before expenses) | $ | 1,000.00 | $ | 1,019.61 | $ | 5.65 | 1.11 | % | ||||||||
| WesMark Tactical Opportunity Fund | ||||||||||||||||
| Actual Fund Return | $ | 1,000.00 | $ | 1,041.40 | $ | 7.00 | 1.36 | % | ||||||||
| Hypothetical Fund Return (assuming a 5% return before expenses) | $ | 1,000.00 | $ | 1,018.35 | $ | 6.92 | 1.36 | % | ||||||||
| WesMark Large Company Fund | ||||||||||||||||
| Actual Fund Return | $ | 1,000.00 | $ | 1,089.20 | $ | 5.95 | 1.13 | % | ||||||||
| Hypothetical Fund Return (assuming a 5% return before expenses) | $ | 1,000.00 | $ | 1,019.51 | $ | 5.75 | 1.13 | % | ||||||||
| (1) | Expenses are equal to the Funds’ annualized net expense ratios, multiplied by the average account value over the period, multiplied by 184/365 (to reflect the six month period). |
| (2) | Annualized, based on the Fund’s most recent fiscal half-year expenses. |
| 72 | |
www.wesmarkfunds.com |
| Board of Trustees and Trust Officers |
| December 31, 2023 (Unaudited) |
The Board is responsible for managing the Trust’s
business affairs and for exercising all the Trust’s powers except those reserved for the shareholders. The following tables give
information about each Board member and the senior officers of the Funds. Where required, the tables separately list Board members who
are “interested persons” of the Funds (i.e., “Interested” Board members) and those who are not (i.e., “Independent”
Board members). The WesMark Fund Complex consists of one Investment Company (comprising six portfolios). Unless otherwise noted, each
Officer is elected annually; each Board member oversees all portfolios in the WesMark Fund Complex; and serves for an indefinite term.
| Name, Year of Birth, Address* and Date Service Began |
Principal Occupations in Past Five Years, other Directorships |
| Independent Trustees | |
|
Lawrence E. Bandi (1954)
TRUSTEE Began serving September 2004 |
Principal Occupations: Retired
Other Directorships: Welty Corporation, WVNCC
Previous Positions: President, Central Catholic |
|
Jordan A. Miller, Jr. (1951)
TRUSTEE Began serving March 2021 |
Principal Occupation: Retired
Previous Positions and Directorships: Regional |
|
Gary J. Madich (1955)
TRUSTEE Began serving November 2020 |
Principal Occupation: Retired
Other Directorships: Managing Director/CEO |
| Interested Trustees | |
|
J. Christopher Gardill** (1976)
CHAIRMAN AND TRUSTEE Began serving August 2015 |
Principal Occupations: Member, Phillips, Gardill,
Other Directorships: Board Member, Wheeling |
| * | All Trustees may be reached via the Funds at 1290 Broadway, Suite 1000, Denver, CO, 80203. |
| ** | Mr. Gardill has served as Chairman since February 1, 2022. Mr. Gardill is an interested person due to his affiliation with Phillips, Gardill, Kaiser & Altmeyer, PLLC who serves as legal counsel to WesBanco Inc. and WesBanco Bank. The Funds’ investment adviser, WesBanco Investment Department, is a division of WesBanco Bank, Inc., a wholly owned subsidiary of WesBanco, Inc. Mr. Gardill was also an independent consultant to the Trust Committee of WesBanco Bank, Inc. |
| Annual Report | December 31, 2023 | |
73 |
| Board of Trustees and Trust Officers |
| December 31, 2023 (Unaudited) |
The name, address, age and principal occupations for the past five years
of the officers of the Trust are listed below. Each officer serves as an officer of the six fund portfolios that comprise the Trust.
| Name, Year of Birth and Address* | Positions Held with Fund Date Service Began | Principal Occupation(s) and Previous Position(s) |
| Officers | ||
|
Scott Love (1976) |
CHIEF EXECUTIVE OFFICER, PRESIDENT Began Serving: March 2020 |
Principal Occupations: Co-Portfolio Manager of the WesMark Funds;
Previous Positions: Vice President of the WesMark Funds. |
|
Jennifer S. Roth (1975) |
CHIEF COMPLIANCE OFFICER Began Serving: August 2019 |
Principal Occupations: Chief Compliance Officer of the WesMark Funds;
Previous Positions: Chief Compliance Officer/Compliance Manager, |
|
Steven Kellas (1966) |
CHIEF FINANCIAL OFFICER, TREASURER Began Serving: January 2013 |
Principal Occupation: Co-Portfolio Manager, Treasurer and Chief Financial Officer of the WesMark Funds, Executive Vice President WesBanco Trust and Investment Services. |
|
Todd P. Zerega (1974) |
SECRETARY Began Serving: September 2004 |
Principal Occupations: Partner, Perkins Coie LLP. |
|
Ian Kilgour (1994) |
VICE PRESIDENT Began serving February 2023 |
Principal Occupation: Senior Investment Officer – Funds of the WesMark
Previous Positions: Investment Officer/Securities Trader, WesMark |
|
Nicholas Adams (1983) |
ASSISTANT SECRETARY Began Serving: March 2022 |
Principal Occupation: Principal Legal Counsel SS&C ALPS since
Previous Positions: Associate Attorney, Arnold, Newbold, Sollars |
|
Scott Fuchs (1969) |
ASSISTANT TREASURER Began Serving: August 2022 |
Principal Occupation: Fund Controller, SS&C ALPS since May 2022.
Previous Positions: Vice President at GAMCO Investors, Inc. from |
| 74 | |
www.wesmarkfunds.com |
| Statement Regarding the Liquidity Risk Management Program |
| December 31, 2023 (Unaudited) |
The WesMark Funds have adopted a liquidity risk management
program pursuant to Rule 22e-4 (the “Liquidity Rule”) under the Investment Company Act of 1940, as amended (the “Program”).
The Funds’ Board of Trustees (the “Board”) has designated WesBanco Investment Department as the administrator of the Program.
The Program’s principal objectives are to support the Funds’ compliance with limits on investments in illiquid assets and to mitigate
the risk that a Fund is unable to meet its redemption obligations on a timely basis. In this regard, the Program includes a number of
elements that support the management or assessment of liquidity risk, including an assessment of factors that influence a Fund’s liquidity
and the periodic classification and, as determined necessary, re-classification of a Fund’s investments into buckets that reflect the
relative liquidity under current market conditions.
On November 14, 2023, the Funds’ Board reviewed a
written report from the Program administrator that addressed the operation of the Program, assessed its adequacy and effectiveness since
November 15, 2022, the date of the last report, and recommended certain minor modifications to the Program. The Administrator’s report
described the key features of the Funds’ liquidity risk management program, including the liquidity classification methodology and classifications
of the holdings for each of the WesMark Funds, the status of regulatory filings required by the Liquidity Rule, a summary of exam and
inspection results during the period, an update of monitoring of illiquid securities, and a review of redemptions in-kind policies and
procedures. No changes were recommended to the Funds’ highly liquid investment minimum (“HLIM”) by the Administrator based upon
the determination that the Funds were primarily highly liquid funds. Based upon this recommendation, the Board approved the unchanged
HLIM. Lastly, the Board approved immaterial changes to the policies and procedures for clarity. Upon completion of the review, the Board
concluded that based on the operation of the functions, as described in the Report, the Program is operating as intended and is effective
in implementing the requirements of the Liquidity Rule.
| Annual Report | December 31, 2023 | |
75 |
| Additional Information |
| December 31, 2023 (Unaudited) |
Mutual funds are not bank deposits or obligations,
are not guaranteed by any bank, and are not insured or guaranteed by the U.S. government, the Federal Deposit Insurance Corporation, the
Federal Reserve Board, or any other government agency. Investment in mutual funds involves investment risk, including the possible loss
of principal.
This report is authorized for distribution to prospective
investors only when preceded or accompanied by the funds’ prospectus which contains facts concerning its objective and policies,
management fees, expenses and other information.
VOTING PROXIES ON FUND PORTFOLIO SECURITIES
A description of the policies and procedures that
the Funds use to determine how to vote proxies relating to securities held in a Fund’s portfolio is available, without charge and
upon request, by calling 1-800-864-1013. A report on Form N-PX of how the Funds voted any such proxies during the most recent 12-month
period ended June 30 is available without charge and upon request by calling the Funds toll-free at 1-800-864-1013. This information is
also available from the EDGAR database on the SEC’s website at https://www.sec.gov.
QUARTERLY PORTFOLIO SCHEDULE
The Funds file with the SEC a complete schedule of
their portfolio holdings, as of the close of the first and third quarters of its fiscal year, on Form N-PORT. These filings are also available
on the SEC’s website at http://www.sec.gov and may be reviewed and copied at the SEC’s Public Reference Room in Washington,
DC (call 1-800-SEC-0330 for information on the operation of the Public Reference Room). You may also access this information on the WesMark
Funds website at www.wesmarkfunds.com by clicking on “Quarterly Reports”, then selecting the name of the Fund.
NOTICE TO STOCKHOLDERS
For the year ended December 31, 2023, 100% of the
distributions from net investment income for West Virginia Municipal Bond Fund are exempt from federal income tax.
Of the ordinary income (including short-term capital
gain) distributions made by the Funds during the year ended December 31, 2023, the percentages qualifying for the dividend received deduction
available to corporate shareholders are as follows:
| Fund Name | Percentage |
| Small Company Fund | 100.00% |
| Large Company Fund | 100.00% |
| Balanced Fund | 85.38% |
| Tactical Opportunity Fund | 66.25% |
For the year ended December 31, 2023, the following
percentages of total ordinary dividends paid by the Funds are qualifying dividends which may be subject to a maximum tax rate of 15%,
as provided for by the Jobs and Growth Tax Relief Act of 2003. Complete information will be reported in conjunction with the reporting
of your distributions on Form 1099-DIV. The percentages were as follows:
| Fund Name | Percentage |
| Small Company Fund | 100.00% |
| Large Company Fund | 100.00% |
| Balanced Fund | 85.38% |
| Tactical Opportunity Fund | 87.61% |
Pursuant to Section 852(b)(3) of the Internal Revenue Code, Small Company
Growth Fund, Large Company Fund, and Balanced Fund designated $6,008,526, $21,879,756, and $2,635,268, respectively as long-term capital
gain dividends.
| 76 | |
www.wesmarkfunds.com |
| Glossary of Terms |
| December 31, 2023 (Unaudited) |
Basis points – a unit that is
equal to 1/100th of 1% and is used to denote the change in a financial instrument.
Collateralized Mortgage Obligation –
complex mortgage backed securities that allocate payments and prepayments from an underlying mortgage pools among holders of different
classes or tranches of the CMO.
Commercial Mortgage Securities (CMBS) –
fixed-income investment products that are backed by mortgages on commercial properties rather than residential real estate.
Consumer Price Index (CPI) –
a measure of the average change over time in the prices paid by urban consumers for a market basket of consumer goods and services.
Covered call –
an options strategy where an investor holds a long position in an asset and writes (sells) call options on that same asset to generate
an income stream.
Duration –
a measure of a security’s price sensitivity to changes in interest rates. Securities with longer durations are more sensitive to
changes in interest rates than securities of shorter durations.
Fannie Mae and Freddie Mac –
government sponsored entities that receive support through federal subsidies, loan or other benefits.
Floating rate debt – a debt
instrument with a variable interest rate.
HFRI Fund of Funds Composite Index –
The Hedge Fund Research, Inc. (HFRI) Fund of Funds Composite Index is an equal weighted index that consists of over 800 constituent hedge
funds, including both domestic and offshore funds.
LIBOR –
London Interbank Offered Rate – a benchmark interest rate at which major global banks lend to one another in the international interbank
market for short-term loans.
Maturity –
maturity date refers to the final payment date of a loan or other financial instrument, at which point the principal (and all remaining
interest) is due to be paid.
Mortgage Backed Securities –
a type of asset-backed security that is secured by a mortgage or collection of mortgages.
Mortgage Pool –
a group of mortgages with similar interest rates and maturity dates “pooled together” for the issuance of a mortgage-backed
security. Some mortgage-backed securities issued by Fannie Mae, Freddie Mac and Ginnie Mae are known as “pools” themselves.
These are the simplest form of mortgage-backed security.
MSCI All World index – The MSCI
All World Index captures large and mid-c stocks across 23 developed and 27 emerging markets.
MSCI EAFA Index –
The MSCI EAFE Index is an equity index which captures large and mid cap representation across 21 Developed Markets countries around the
world, excluding the US and Canada.
MSCI Emerging Markets Index –
The MSCI Emerging Markets Index captures large and mid cap representation across 27 Emerging Markets (EM) countries.
Options –
a contract which offers the buyer the right, but not the obligation, to buy (call option) or sell (put option) the underlying asset at
an agreed-upon price during a certain period of time or on a specific date.
Russell 2000 Index –
an index measuring the performance of approximately 2,000 small-cap companies in the Russell 3000 Index, which is made up of 3,000 of
the biggest U.S. stocks. The Russell 2000 serves as a benchmark for small-cap stocks in the United States.
S&P 500 – a market-capitalization-weighted
index of the 500 largest publicly-traded companies in the U.S.
| Annual Report | December 31, 2023 | |
77 |
| Glossary of Terms |
| December 31, 2023 (Unaudited) |
S&P 600 – An index of small-cap stocks
managed by Standard and Poor’s. The S&P 600 SmallCap Index covers a broad range of small cap stocks in the United States. The index
is weighted according to market capitalization and covers about 3-4% of the total market for equities in the United States.
VIX Index –
The Volatility Index, or VIX, is a real-time market index created by the Chicago Board Options Exchange (CBOE) that represents the market’s
expectation of 30-day forward-looking volatility. Derived from the price inputs of the S&P 500 index options, it provides a measure
of market risk and investors’ sentiments.
Yield –
the income return on an investment, such as the interest or dividends received from holding a particular security.
Yield curve –
a line that plots the interest rates, at a set point in time, of bonds having equal credit quality but differing maturity dates.
Yield spread –
the difference between yields on differing debt instruments of varying maturities, credit ratings and risk, calculated by deducting the
yield of one instrument from another.
Investment Ratings:
| Description | Standard and Poor’s Long-Term Debt Rating | Moody’s Investors Service Long-Term Bond Rating |
| Highest rating available. Capacity to pay interest and repay principal is extremely strong. Carry smallest degree of investment risk. | AAA | Aaa |
| Very strong capacity to pay interest and repay principal. Differ from AAA rated securities by very small degree. Still considered high grade obligation. | AA | Aa |
| Strong capacity to pay interest and repay principal although is somewhat more susceptible to adverse effects of changes in circumstances and economic conditions than those rated higher. Considered upper medium grade obligation. | A | A |
| Regarded as having an adequate capacity to pay interest and repay principal. Any adverse economic conditions or changing circumstances are more likely to lead to a weakened capacity to pay vs. those rated higher. Considered medium grade obligation. | BBB | Baa |
| Judged to have speculative elements, but has less near-term vulnerability to default than other speculative=e issues. Faces major ongoing uncertainties or exposure to adverse business, financial, or economic conditions which could lead to inadequate capacity to meet timely interest and principal payments. | BB | Ba |
| Has greater vulnerability to default but currently has capacity to meet interest payments and principal repayments. Adverse business, financial, or economic conditions will likely impair capacity or willingness to pay interest or principal. Generally lack characteristics of the desirable investment. |
B | B |
| Currently identifiable vulnerability to default and is dependent upon favorable business, financial, and economic conditions to meet timely payment of interest and repayment of principal. Such issues may be in default or there may be present elements of danger with respect to principal or interest. | CCC | Caa |
| Typically applied to debt subordinated to senior debt that is assigned an actual or implied CCC debt rating (by S&P). Represent obligations which are speculative in a high degree. | CC | Ca |
| Typically applied to debt subordinated to senior debt which has been assigned an actual or implied CCC-debt rating (by S&P). Represents the lowest rated class of bonds. | C | C |
Credit rating firms, such as Standard &
Poor’s and Moody’s, use different designations consisting of upper- and lower-case letters ‘A’ and ‘B’ to identify a bond’s credit
quality rating. ‘AAA’ and ‘AA’ (high credit quality) and ‘A’ and ‘BBB’ (medium credit quality) are considered investment grade.
Credit ratings for bonds below these designations (‘BB’, ‘B’, ‘CCC’, etc.) are considered low credit quality, and are commonly
referred to as “junk bonds.”
| 78 | |
www.wesmarkfunds.com |
Intentionally Left Blank
Item 2. Code of Ethics.
(a) As
of the end of the period covered by this report, the registrant has adopted a code of ethics (the “Section 406 Standards for Investment
Companies – Ethical Standards for Principal Executive and Financial Officers”) that applies to the registrant’s Principal
Executive Officer and Principal Financial Officer.
(b) Not applicable.
(c) During
the period covered by this report, no amendments were made to the provisions of the code of ethics adopted in 2(a) above.
(d) During
the period covered by this report, no implicit or explicit waivers to the provisions of the code of ethics adopted in 2(a) above were
granted.
(e) Not applicable
to the registrant.
(f)(3) The registrant hereby
undertakes to provide to any person, without charge, upon request, a copy of the code of ethics referenced in Item 2(a) above. To request
a copy of the code of ethics, contact the registrant at 1-800-864-1013.
Item 3. Audit Committee Financial Expert.
The registrant’s Board of Trustees has determined
that the following members of the Board’s Audit Committee are each an “audit committee financial expert” and are “independent”
for purposes of this Item: Lawrence E. Bandi and Jordan A. Miller, Jr.
Item 4. Principal Accountant Fees and Services.
(a) Audit
Fees. The aggregate fees billed in each of the fiscal years ended December 31, 2022 and December 31, 2023 for professional services
rendered by the principal accountant for the audit of the registrant’s annual financial statements or services that are normally
provided by the accountant in connection with statutory and regulatory filings or engagements were $87,000 and $87,500 respectively.
(b) Audit-Related
Fees. The aggregate fees billed in each of the fiscal years ended December 31, 2022 and December 31, 2023 for assurance and related
services by the principal accountant that are reasonably related to the performance of the audit of the registrant’s financial statements
and are not reported under paragraph (a) of this Item were $0 and $0, respectively.
(c) Tax
Fees. The aggregate fees billed in each of the fiscal years ended December 31, 2022 and December 31, 2023 for professional services
rendered by the principal accountant for tax compliance, tax advice and tax planning were $19,500 and $19,500, respectively.
(d) All
Other Fees. The aggregate fees billed in each of the fiscal years ended December 31, 2022 and December 31, 2023 for products and services
provided by the principal accountant, other than the services reported in paragraphs (a) through (c) of this Item were $13,000 and $13,000
respectively. These services were provided in connection with conducting Rule 17f-2 examinations and preparing related SEC filings.
(e)(1) Audit Committee Policies Regarding Pre-approval
of Services.
The Audit Committee is required
to pre-approve audit and non-audit services performed by the independent auditor in order to assure that the provision of such services
does not impair the auditor’s independence. Unless a type of service to be provided by the independent auditor has received general
pre-approval, it will require specific pre-approval by the Audit Committee. Any proposed services exceeding pre-approved cost levels will
require specific pre-approval by the Audit Committee.
Certain services have the general
pre-approval of the Audit Committee. The term of the general pre-approval is 12 months from the date of pre-approval, unless the Audit
Committee specifically provides for a different period. The Audit Committee will annually review the services that may be provided by
the independent auditor without obtaining specific pre-approval from the Audit Committee and may grant general pre-approval for such services.
The Audit Committee will revise the list of general pre-approved services from time to time, based on subsequent determinations. The Audit
Committee will not delegate its responsibilities to pre-approve services performed by the independent auditor to management.
The Audit Committee has delegated
pre-approval authority to its Chairman. The Chairman will report any pre-approval decisions to the Audit Committee at its next scheduled
meeting. The Committee will designate another member with such pre-approval authority when the Chairman is unavailable.
AUDIT SERVICES
The annual Audit Services engagement
terms and fees will be subject to the specific pre-approval of the Audit Committee. The Audit Committee must approve any changes in terms,
conditions and fees resulting from changes in audit scope, registered investment company structure or other matters.
In addition to the annual Audit
services engagement specifically approved by the Audit Committee, the Audit Committee may grant general pre-approval for other Audit Services,
which are those services that only the independent auditor reasonably can provide. The Audit Committee has pre-approved certain Audit
Services; all other Audit Services must be specifically pre-approved by the Audit Committee.
AUDIT-RELATED SERVICES
Audit-Related Services are assurance
and related services that are reasonably related to the performance of the audit or review of the registrant’s financial statements
or that are traditionally performed by the independent auditor. The Audit Committee believes that the provision of Audit-Related Services
does not impair the independence of the auditor, and has pre-approved certain Audit-Related Services; all other Audit-Related Services
must be specifically pre-approved by the Audit Committee.
TAX SERVICES
The Audit Committee believes
that the independent auditor can provide Tax Services to the registrant such as tax compliance, tax planning and tax advice without impairing
the auditor’s independence. However, the Audit Committee will not permit the retention of the independent auditor in connection
with a transaction initially recommended by the independent auditor, the purpose of which may be tax avoidance and the tax treatment of
which may not be supported in the Internal Revenue Code and related regulations. The Audit Committee has pre-approved certain Tax Services;
all Tax Services involving large and complex transactions must be specifically pre-approved by the Audit Committee.
ALL OTHER SERVICES
With respect to the provision
of services other than audit, review or attest services the pre-approval requirement is waived if:
| (1) | The aggregate amount of all such services provided constitutes no more than five percent of the total amount of revenues paid by the registrant, the registrant’s adviser (not including any sub-adviser whose role is primarily portfolio management and is subcontracted with or overseen by another investment adviser), and any entity controlling, controlled by, or under common control with the investment adviser that provides ongoing services to the registrant to its accountant during the fiscal year in which the services are provided; |
| (2) | Such services were not recognized by the registrant, the registrant’s adviser (not including any sub-adviser whose role is primarily portfolio management and is subcontracted with or overseen by another investment adviser), and any entity controlling, controlled by, or under common control with the investment adviser that provides ongoing services to the registrant at the time of the engagement to be non-audit services; and |
| (3) | Such services are promptly brought to the attention of the Audit Committee of the issuer and approved prior to the completion of the audit by the Audit Committee or by one or more members of the Audit Committee who are members of the board of directors to whom authority to grant such approvals has been delegated by the Audit Committee. |
The Audit Committee may grant
general pre-approval to those permissible non-audit services classified as All Other services that it believes are routine and recurring
services, and would not impair the independence of the auditor.
The SEC’s rules and relevant
guidance should be consulted to determine the precise definitions of prohibited non-audit services and the applicability of exceptions
to certain of the prohibitions.
PRE-APPROVAL FEE LEVELS
Pre-approval fee levels for all
services to be provided by the independent auditor will be established annually by the Audit Committee. Any proposed services exceeding
these levels will require specific pre-approval by the Audit Committee.
PROCEDURES
Requests or applications to provide
services that require specific approval by the Audit Committee will be submitted to the Audit Committee by both the independent auditor
and the Principal Accounting Officer and/or Internal Auditor, and must include a joint statement as to whether, in their view, the request
or application is consistent with the SEC’s rules on auditor independence.
(e)(2) The
services described in paragraphs (c) and (d) of this Item were approved by the registrant’s Audit Committee pursuant to paragraph
(c)(7)(i)(C) of Rule 2-01 of Regulation S-X. There were no services of the kind described in paragraph (b) of this Item provided.
(f) Not
applicable to registrant.
(g) Non-Audit
Fees. The aggregate non-audit fees billed by the registrant’s accountant for services rendered to the registrant, and rendered
to the registrant’s investment adviser, and any entity controlling, controlled by, or under common control with the adviser that
provides ongoing services to the registrant for each of the fiscal years of the registrant ended December 31, 2022 and December 31, 2023
were $14,500 and $14,500, respectively.
(h) The
registrant’s Audit Committee has considered that the provision of non-audit services that were rendered to the registrant’s
adviser, and any entity controlling, controlled by, or under common control with the investment adviser that provides ongoing services
to the registrant that were not pre-approved pursuant to paragraph (c)(7)(ii) of Rule 2-01 of Regulation S-X is compatible with maintaining
the principal accountant’s independence.
(i) Not
applicable to registrant.
(j) Not
applicable to registrant.
Item 5. Audit Committee of Listed Registrants.
Not applicable to the registrant.
Item 6. Investments.
| (a) | The registrant’s “Schedule I – Investments in securities of unaffiliated issuers” (as set forth in 17 CFR 210.12-12) is included in Item 1 of this Form N-CSR. |
| (b) | Not applicable to the registrant. |
Item 7. Reserved.
Item 8. Reserved
Item 9. Reserved
Item 10. Reserved
Item 11. Reserved.
Item 12. Disclosure of Proxy Voting Policies and Procedures for Closed-End
Management Investment Companies.
Not applicable to the registrant.
Item 13. Portfolio Managers of Closed-End Management Investment Companies.
Not applicable to the registrant.
Item 14. Purchases of Equity Securities by Closed-End Management Investment
Company and Affiliated Purchasers.
Not applicable to the registrant.
Item 15. Submission of Matters to a Vote of Security Holders.
No changes to report.
Item 16. Controls and Procedures.
| (a) | The registrant’s principal executive and principal financial officers have concluded that the registrant’s disclosure controls and procedures (as defined in Rule 30a-3(c) under the Investment Company Act of 1940, as amended (17 CFR 270.30a-3(c))), are effective in design and operation and are sufficient to form the basis of the certifications required by Rule 30a-(2) under the Investment Company Act of 1940, as amended, based on their evaluation of these disclosure controls and procedures within 90 days of the filing date of this report on Form N-CSR. |
| (b) | There were no changes in the registrant’s internal control over financial reporting (as defined in Rule 30a-3(d) under the Investment Company Act of 1940, as amended) that occurred during the period covered by this report that have materially affected, or are reasonably likely to materially affect, the registrant’s internal control over financial reporting. |
Item 17. Disclosure of Securities Lending Activities for Closed-End
Management Investment Companies.
Not applicable.
Item 18. Recovery of Erroneously Awarded Compensation.
Item 19. Exhibits.
SIGNATURES
Pursuant to the requirements of the Securities Exchange
Act of 1934 and the Investment Company Act of 1940, the registrant has duly caused this report to be signed on its behalf by the undersigned,
thereunto duly authorized.
| Registrant | WesMark Funds | |
| By | /s/Scott Love | |
|
Scott Love President and Chief Executive Officer (Principal Executive Officer)
|
||
| Date | March 7, 2024 |
Pursuant to the requirements of the Securities Exchange
Act of 1934 and the Investment Company Act of 1940, this report has been signed below by the following persons on behalf of the registrant
and in the capacities and on the dates indicated.
| By | /s/Scott Love | |
|
Scott Love President and Chief Executive Officer (Principal Executive Officer)
|
||
| Date | March 7, 2024 | |
| By | /s/Steven Kellas | |
|
Steven Kellas Treasurer and Chief Financial Officer (Principal Financial Officer)
|
||
| Date | March 7, 2024 |
ATTACHMENTS / EXHIBITS


