Positive domestic sentiment and favorable global cues played a significant role in lifting the market throughout the day.
Top 3 stocks to buy today, recommended by Ankush Bajaj
Buy: Axis Bank Ltd (current price: ₹1,210)
Why it’s recommended: On the daily chart, the stock has given a head and shoulder breakout, which is a bullish reversal pattern. The RSI is above 60, indicating strong momentum. On lower time frames, the stock has broken out of a falling wedge channel, which further confirms the bullish setup and suggests a potential rally in the stock.
Resistance level: ₹1,235- ₹1,250 (short-term target zone)
Support level: ₹1,195 (pattern invalidation level)
Pattern: Head and shoulder breakout on daily chart; falling wedge breakout on lower time frame
RSI: Bullish on both daily and lower time frames, confirming the breakout
Technical analysis: The stock has broken out of two bullish patterns, showing strong price action and follow-through buying. The RSI adds further confirmation to the bullish structure. Sustaining above ₹1,210 increases the probability of reaching the target zone.
Risk factors: Breakdown below ₹1,195 may invalidate the breakout. Broader market weakness or negative sentiment in the chemical sector may impact performance.
Buy at: ₹1,210
Target price: ₹1,235- ₹1,250 in 4-5 days
Stop loss: ₹1,195
Also read: Charge up your watch list with these five battery storage stocks
Buy: Atul Ltd (current price: ₹7,203)
Why it’s recommended:On the daily chart, the stock has given a flag breakout, which is a bullish continuation pattern. On Thursday the stock gave a clear breakout with strong price action. On the lower time frame, ATUL has also given a triangle breakout, indicating renewed buying interest and strong momentum. These technical signals suggest a potential rally in the stock.
Resistance level: ₹7,300– ₹7,320 (short-term target zone)
Support level: ₹7,150 (pattern invalidation level)
Pattern: Flag breakout on daily chart; triangle breakout on lower time frame
RSI: Bullish on lower time frames, confirming the breakout
Technical analysis: The breakout from both the flag and triangle patterns reflects strong bullish sentiment and follow-through buying. Sustaining above ₹7,203 increases the probability of the stock moving towards the ₹7,300- ₹7,320 target zone.
Risk factors: Breakdown below ₹7,150 may invalidate the bullish setup. Any broader market weakness or sector-specific sentiment could impact the stock’s movement.
Buy at: ₹7,203
Target price: ₹7,300- ₹7,320 in 4-5 days
Stop loss: ₹7,150
Buy: Jindal Steel (current price: ₹953)
Why it’s recommended: On the daily chart, the stock has given a triangle breakout around ₹922, leading to a strong rally. After the breakout, the stock faced some selling pressure on the lower time frame, but it is now trading at a major demand zone. This zone has historically seen buying interest, and a bounce is expected based on the price structure and support levels.
Resistance level: ₹985- ₹990 (short-term target zone)
Support level: ₹938 (pattern invalidation level)
Pattern: Triangle breakout on daily chart; demand zone retest on lower time frame
RSI: Consolidating but holding above key support levels
Technical analysis: The breakout from the triangle on the daily chart triggered a rally, and the current pullback appears to be a healthy retracement to a demand zone. A bounce from these levels would confirm strength and could push the price towards the ₹985- ₹990 zone.
Risk factors: Breakdown below ₹938 may invalidate the bullish view. Broader market weakness or sector-specific negative cues may also impact the stock’s performance.
Buy at: ₹953
Target price: ₹985- ₹990 in 4-5 days
Stop loss: ₹938
Market wrap for Friday, 23 May
The Nifty 50 surged by 243.45 points or 0.99% on Friday to close at 24,853.15. The BSE Sensex gained 769.09 points or 0.95%, settling at 81,721.08. Nifty Bank stocks also saw strong participation, rising 456.95 points or 0.83% to close at 55,398.25.
From a sectoral perspective, market breadth remained strongly positive with bulls firmly in control of most sectors, except for pharma and healthcare. FMCG stocks led the gains with a 1.63% rise, supported by optimism around consumer staples and rural demand. The consumption sector added 1.11% as investor interest returned to discretionary segments. The services sector also advanced by 1.06%, reflecting a broad improvement in demand across its key components. However, the pharma sector slipped by 0.41% due to profit booking in select stocks, while healthcare ended 0.01% lower, weighed down by weak performance in hospital and diagnostic companies.
Also read: A catalyst for Ramco Cements stock is set to play out. But is that enough?
Among the top gainers, Eternal stood out with a 3.72% rally, continuing its recent outperformance and attracting strong institutional interest. HDFC Life Insurance jumped 3.25%, buoyed by positive sentiment around the insurance sector and expectations of margin stability. Jio Finance also performed well, gaining 2.62% on renewed momentum in the NBFC and fintech space.
Sun Pharma led the losers with a 2.04% decline, dragging down the pharma sector amid broader pressure. Grasim also edged 0.57% lower, affected by selective profit booking and subdued sentiment in the materials space.
Nifty technical analysis: Daily & hourly
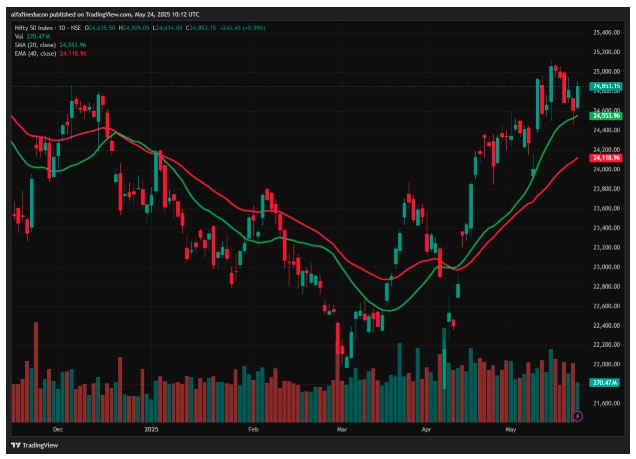
The Nifty opened flat but traded with a positive bias throughout the day, ultimately closing with a gain of about 244 points. On the daily chart, it is evident that the index has managed to hold the support zone between 24,450 and 24,500, and has resumed its upward movement toward the 25,000-25,100 range, which marks the upper boundary of the broad trading range.

View Full Image
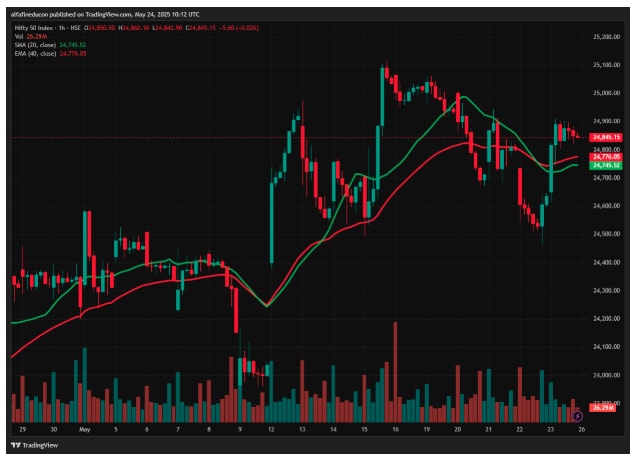
The hourly momentum indicator has triggered a positive crossover, indicating the start of a new bullish cycle. The index is also trading above key hourly moving averages, reinforcing the bullish sentiment. As a result, most technical indicators suggest that the uptrend is likely to continue, with the crucial support zone now shifting higher to the 24,700-24,650 range.
Also read: How Tata Motors plans to win back the market with its hatchbacks

View Full Image
From a technical perspective, the Nifty is trading above both the 20-day moving average (DMA) and the 40-day exponential moving average (DEMA), which currently stand at 24,553 and 24,118.9, respectively. However, the momentum indicator on the daily chart has shown a negative crossover.
On the hourly chart, the Nifty continues to trade above the 20-hour moving average (HMA) and the 40-hour exponential moving average (HEMA), both placed at 24,745. The momentum indicator on the hourly chart, however, has shown a positive crossover, supporting the ongoing bullish trend. Market breadth also remained positive, with 1,721 stocks advancing and 1,140 declining on the National Stock Exchange.
Ankush Bajaj is a Sebi-registered research analyst. His registration number is INH000010441.
Investments in securities are subject to market risks. Read all the related documents carefully before investing.
Registration granted by Sebi and certification from NISM in no way guarantee performance of the intermediary or provide any assurance of returns to investors.
Disclaimer: The views and recommendations given in this article are those of individual analysts. These do not represent the views of Mint. We advise investors to check with certified experts before making any investment decisions.


